
Every crypto trading strategy looks brilliant on a chart of Bitcoin’s rise, and that is exactly the problem. I am Theoneste NZAKIZWANIMANA, founder of TradeLab Research. Over the past months we tested four data-driven crypto ideas, plus a Bitcoin rule from a 39-strategy library, using broker prices, Binance data, real costs and luck tests. None of them passed our bar.
This post walks through each test: what the idea was, what the data said, and why it failed. If you are building or buying a crypto trading strategy, the reasons matter more than the verdicts. Most of them come down to one market rising strongly, to costs, or to too few independent trades.
Table of Contents
How we tested each crypto trading strategy
Our method for a crypto trading strategy is the same as for forex or indices. The strategy’s own rules decide every trade; everything else is checked from the outside. You can read the full version on our how we test page, but here are the parts that matter for crypto.
- Data. OANDA MetaTrader 5 one-minute prices for BTCUSD from 2017 to 2026, with the broker’s recorded spread at each fill. For Ethereum we used Binance ETHUSDT. For order-flow tests we used Binance’s public archive at data.binance.vision, checksum-verified.
- Fills. Entries at the next bar’s open. Stops and targets followed minute by minute. If both were hit in the same minute, the stop counted first.
- Costs. Results are in R (1R is the amount risked), after spread and overnight financing. For crypto we assume 25% a year financing, far above the 3% we assume for forex.
- Time split. SEARCH 2017-06 to 2022-12 for tuning, VALIDATION 2023-2024 run once on frozen candidates, and a LOCKBOX from 2025 that is still sealed.
Every rule, grid and pass threshold was written down and hashed before the run. A candidate from SEARCH needed a plateau (neighbouring settings also positive), at least 200 trades and t ≥ 2.5. In VALIDATION it needed t ≥ 2.0 on at least 100 trades and had to beat 95% of 200 coin-flip runs.
A data warning before any crypto trading strategy test
One thing surprised us early. The broker export recorded a spread of exactly zero for whole months of BTC data, about 12% of all BTC minutes. A backtest run on that data would have shown trades with no cost at all. We replaced each zero with that month’s median spread.
The lesson is simple: before you test any crypto trading strategy, open the spread column and look at it. A cost of zero is not a gift; it is a bug in the data. We describe more of these traps in our trading costs post.
Why crypto needs harsher tests than forex
Crypto moves more than most markets, and that cuts both ways. Big moves make a crypto trading strategy look exciting in a backtest, because a few large trends can carry the whole result. They also make luck look like skill, since one well-timed trade can be worth many ordinary ones.
The history is also short. Our Bitcoin data starts in 2017, and a large part of that period is one long rise of about 8×. A forex rule can be checked against many years of mixed conditions; a crypto trading strategy has far fewer to learn from. That is why we insist on a sealed later period and on luck tests for every crypto result.
Idea 1: a breakout crypto trading strategy that vanished
The Williams volatility breakout is a classic: buy when price moves a set fraction of yesterday’s range above today’s open. In our edge search we first tried it on stock indices. It looked like a pass in round 1, with t 2.24 on 868 trades in 2023-24, until we found a bug.
Its end-of-day exit sat at the broker’s daily break, so trades were held over the reopen and over weekends. That extra holding supplied about 120R of its 156R. We voided the pass, fixed the exit, and the corrected rule failed. I mention it here because it is the same lesson that crypto later taught us again: check where the profit really comes from.
Where the profit came from
When we searched the Williams breakout again across all our markets, the profit in SEARCH came entirely from Bitcoin and Ethereum. Without crypto, the result was about zero. On paper, that turns it into a crypto trading strategy: a breakout rule that only works on coins.
Then we ran VALIDATION on 2023-2024. The crypto effect vanished. The three results came out at t 1.02, 1.22 and −0.43, all well below the pass bar of 2.0. Whatever made breakouts work on crypto from 2017 to 2022 did not carry into the next two years.
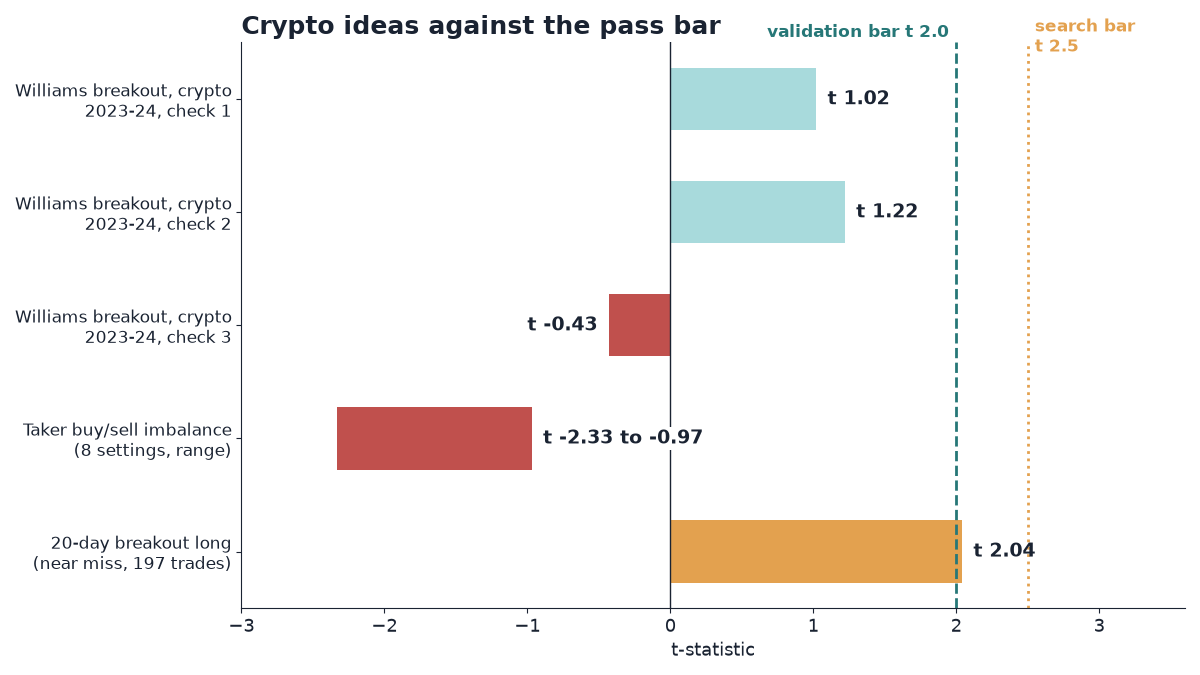
This is the most common pattern we see. A crypto trading strategy built on 2017-2022 data is partly a bet on that era’s huge trends. When the era changes, the rule has nothing left. Our out-of-sample testing post explains why we always keep later years untouched.
Idea 2: taker buy/sell imbalance as a crypto trading strategy
Binance publishes how much volume came from takers buying (hitting the ask) and takers selling (hitting the bid). The idea is attractive: if aggressive buyers dominate a day, perhaps price keeps rising, or perhaps the crowd is exhausted and price reverses. Both versions make a plausible crypto trading strategy.
We downloaded the taker data from Binance’s archive, checked every file against its published checksum, and tested 8 settings. All 8 were negative, with t-statistics from −0.97 to −2.33. Not one setting showed a positive result after costs.
Why the signal mirrors the day’s move
When we looked closer, the reason was clear. The taker-buy share mostly mirrors the day’s own price move, with a rank correlation of 0.43 to 0.48. On a day when price rises, more takers buy. That is not new information about tomorrow; it is a description of today.
A crypto trading strategy built on taker flow is therefore mostly a strategy built on yesterday’s return, wearing different clothes. Many “order-flow” indicators share this problem. Before you trust one, check how closely it tracks plain price change.
We found a related issue with volume. Broker tick volume flagged only about 20% of Binance’s real high-volume days. If your crypto trading strategy uses volume from a CFD broker, it may not be measuring what you think. In our tests, big daily moves on high volume did not continue anyway.
Idea 3: the funding-rate contrarian rule we never ran
Perpetual futures charge a funding rate between longs and shorts, usually every 8 hours. When funding is extremely positive, longs are paying heavily to stay in, and a contrarian might bet on a fall. It is one of the most popular ideas for a crypto trading strategy built on derivatives data.
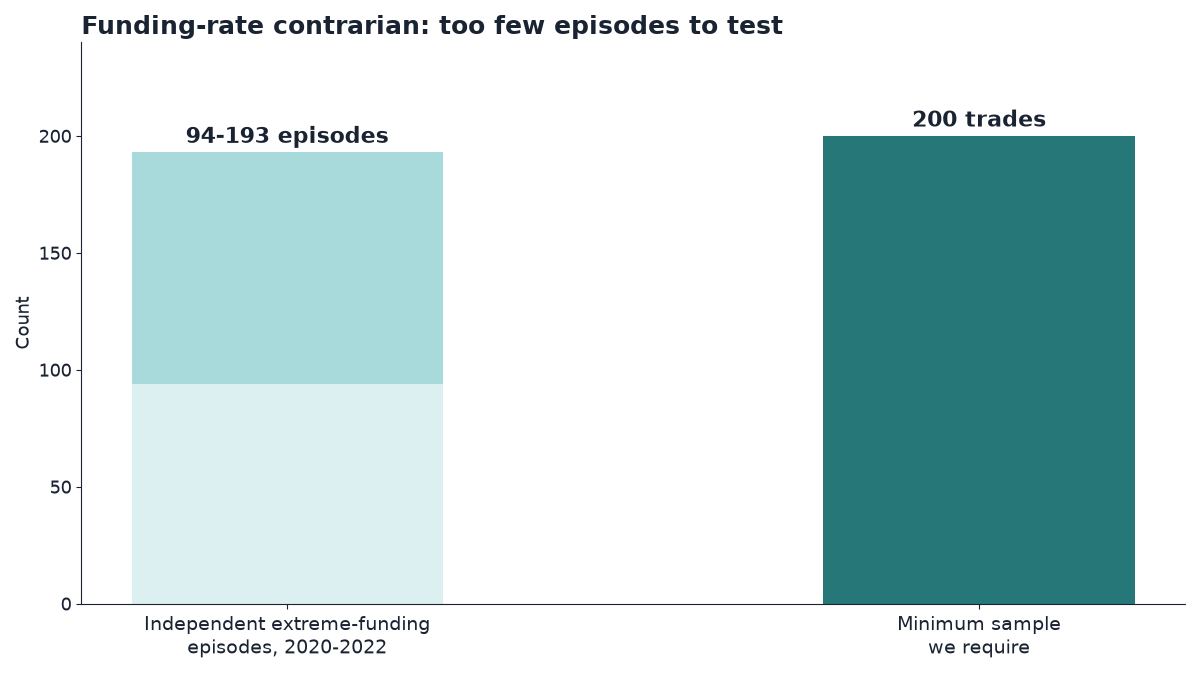
We dropped it before testing. Between 2020 and 2022 there were only 94 to 193 independent extreme-funding episodes. Our rules require at least 200 trades for a SEARCH candidate. With fewer independent events than that, no result could be trusted, positive or negative.
Why “independent” matters
Funding stays extreme for days. If you count every 8-hour reading as a separate signal, you can produce hundreds of “trades” from a handful of episodes. Those trades are not independent: they win or lose together. A backtest built that way looks far more certain than it is.
This is a form of data dredging: the sample looks large, but the information in it is small. Skipping this crypto trading strategy test was the honest call. A crypto trading strategy needs enough separate events to tell skill from luck.
Idea 4: crypto funding times and the Monday reversal
The fourth family looked at the calendar. Crypto trades all week, but funding is paid at fixed times and traditional markets close at the weekend. We tested two ideas: price behaviour around the funding times, and a reversal on Mondays after weekend moves.
Neither produced a stable plateau of positive neighbouring settings, so neither became a candidate. It was one of the 38 families in our 806-setting search, which ended with zero valid passes.
Calendar effects are a natural place to look for a crypto trading strategy because the market structure is unusual. But “unusual structure” is not the same as “repeatable edge.” When many small calendar ideas are tested, some will look good by chance, which is the multiple comparisons problem. A real effect should hold across neighbouring settings, not in one lucky cell.
What a calendar crypto trading strategy would need
For a calendar idea to convince us, it would need three things. First, a reason that does not depend on one period, such as a structural flow that repeats every week. Second, a result that holds across nearby settings, for example several entry hours, not just one. Third, enough independent weeks to beat random entries at the same times.
Our funding-time and Monday tests did not meet the second condition, so they never reached the third. A calendar crypto trading strategy that only works at one exact hour is far more likely to be noise than a habit of the market.
The Bitcoin pass that financing erased
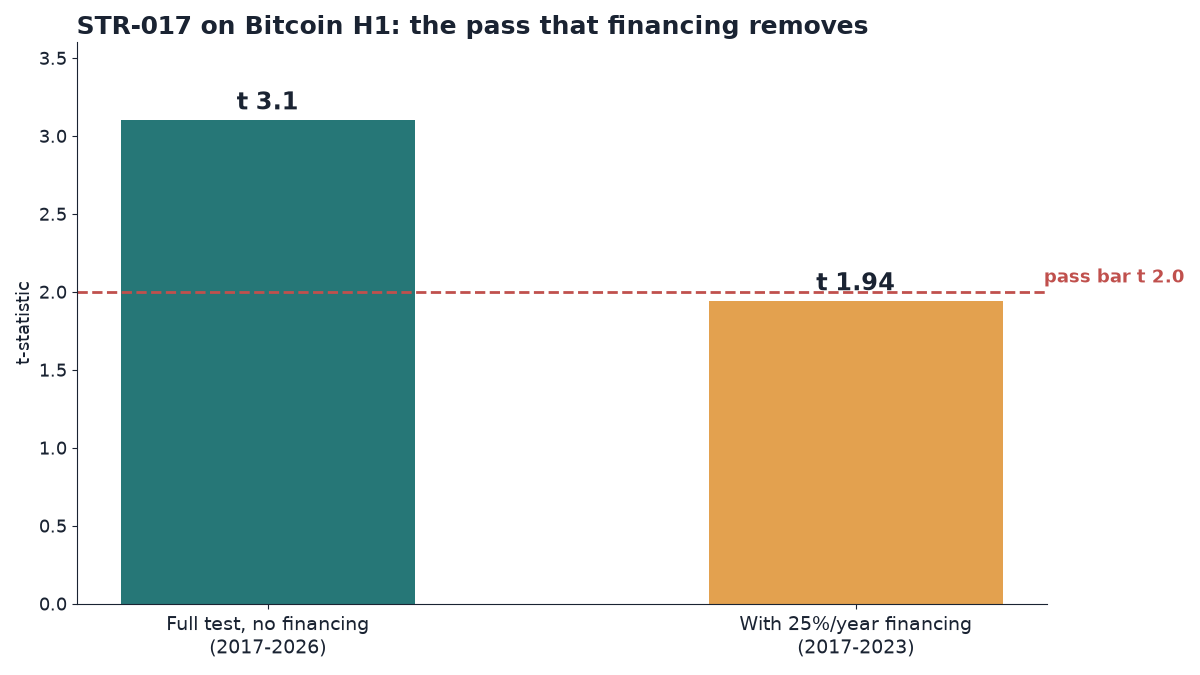
Separately from the four ideas above, we ran an independent assessment of a 39-strategy library on EURUSD, GBPUSD, USDJPY and BTCUSD. One strategy passed: STR-017, a linear regression slope rule on BTCUSD H1, with +0.32R per trade and t 3.1.
At first glance that looks like a winning crypto trading strategy. Look closer and its gains came mostly from long trades while Bitcoin rose about 8× over the period. A rule that leans long in a market that rises eightfold will look good almost whatever its entry logic.
Then we added realistic financing to this crypto trading strategy. Holding crypto CFDs overnight is expensive, and we assume 25% a year. With that cost included, STR-017 no longer passes: on 2017-2023 its t fell to 1.94, just under the 2.0 bar. Our swap fees post shows how financing works and why it hits long holds hardest.
Four other strategies in the same library ended as inconclusive: trend rules such as Donchian and Supertrend that were positive on BTCUSD H1 in 2017-2023 but not confirmed in 2024-2026. Same market, same pattern, same doubt.
Random longs in a rising market
How do you tell a good long-only rule from simply being long Bitcoin? Our luck test answers that. For every long-only rule we also run 200 “random long” versions on the same bars. The real rule must beat 95% of them, as well as 95% of 200 coin-flip runs.
In a market that rose eightfold, random longs share in that rise too. That is the point. If your crypto trading strategy cannot beat a random long on the same data, its profit belongs to the market, not to the rule. Our luck test post explains the method in detail.
The near miss: a 20-day breakout driven by Bitcoin and Ethereum
Our closest call was a 20-day Donchian breakout long: buy when price closes above its 20-day high. It reached t 2.04 on 197 trades, short of the t 2.5 and 200 trades that a SEARCH candidate needs. It is not a pass.
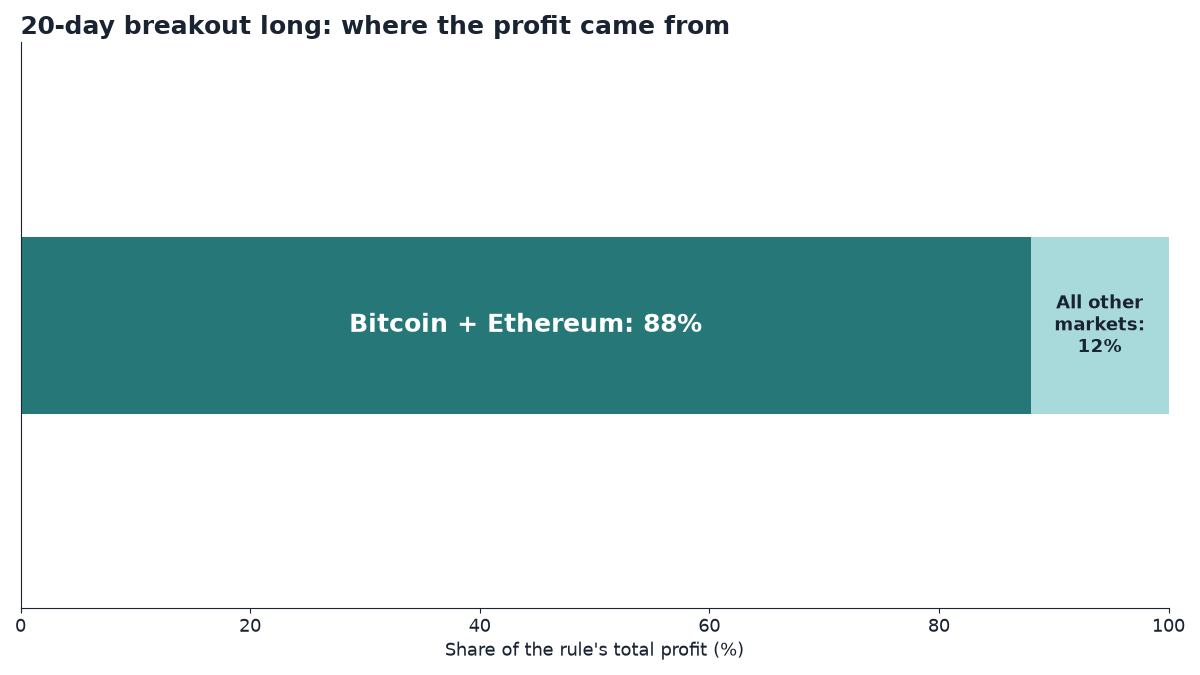
When we split the profit of this crypto trading strategy by market, Bitcoin and Ethereum gave 88% of it. The other markets together gave only 12%. So, in practice, this is another crypto trading strategy hiding inside a general breakout rule, and it relies on the same strong trends that lifted STR-017.
We keep it, with two other near misses, only for forward paper testing. No money is at risk, and the read-out date is fixed in advance: 2027-11-30. If it holds up on data it has never seen, we will report it. If not, we will report that too.
Lessons for any crypto trading strategy
Across all these tests, the same four lessons kept coming back for every crypto trading strategy we looked at. They apply whether you code your own rules, buy a bot or follow signals.
- Separate the rule from the trend. Bitcoin rose about 8× over our test period. A crypto trading strategy that leans long will look good on that alone. Compare it with random longs.
- Charge real financing. At 25% a year, holding costs can erase a pass. Ask your broker for the exact rate and put it in the backtest.
- Count independent events, not rows. Signals that cluster, such as extreme funding, give fewer real trades than the data suggests.
- Check that the signal is new. Taker flow mostly repeated the day’s move. Many indicators repeat price in another form.
Overfitting is the biggest risk
Crypto has a short history and a few enormous trends. That makes overfitting easy: a rule tuned on 2017-2022 can fit those trends perfectly and fail afterwards. The Williams breakout is a clear example. Our results across 25 suggested improvements, tested on new markets including ETH from 2024 to 2026, confirmed none of them at the corrected bar of t ≥ 3.11.
If you want the wider context, our post on retail traders statistics shows how the same patterns appear in large studies of real accounts, and our backtest results post covers the whole 806-setting search.
Programme 2: the same test on perpetual futures
A fair objection to all of the above is cost. A crypto trading strategy tested on CFDs carries CFD costs. CFD financing of 25% a year is heavy, and crypto perpetual futures are cheaper to hold for many traders. So we started Programme 2: the same method applied to Binance USDⓈ-M perpetual futures.
The cost model is lower and more realistic for that market: a 0.05% fee plus 0.02-0.05% slippage per side, and the real 8-hourly funding instead of an assumed rate. The universe is a point-in-time top-20 list drawn from 137 coins, including delisted ones. We checked that coins such as LUNA and FTT, which collapsed, are in the data.
That last point matters for any crypto trading strategy test. If you only test coins that exist today, you skip the ones that went to zero, and your results look better than reality. Programme 2 had 52 pre-registered settings. None of them became a candidate, so its lockbox was never opened, and the programme closed with zero passes, the same result as the CFD search.
What we will not do
We will not move the pass bar to rescue an idea, and we will not open the 2025 lockbox early. If a crypto trading strategy fails, it fails, and we report it. That rule is what makes a pass, if one ever comes, worth anything.
Key takeaways
- The Williams breakout made its SEARCH profit almost entirely on Bitcoin and Ethereum; in 2023-24 the effect vanished (t 1.02, 1.22, −0.43).
- Taker buy/sell imbalance failed in all 8 settings (t −0.97 to −2.33), because it mostly mirrors the day’s own move.
- The funding-rate contrarian rule was dropped: only 94-193 independent episodes, under our 200-trade minimum.
- Crypto funding times and the Monday reversal produced no stable plateau and no candidate.
- STR-017’s Bitcoin pass came mostly from longs in a market that rose about 8×, and it did not survive 25% a year financing.
- The 20-day breakout near miss (t 2.04, 197 trades) got 88% of its profit from Bitcoin and Ethereum; it is in paper testing only.
- Programme 2 on Binance perpetual futures (52 settings, real funding, lower costs) also ended with 0 candidates; its lockbox was never opened.
Every result in this post is a historical simulation, not investment advice and not a promise of any return. If you want to see how we test any crypto trading strategy, read our method. If you have a bot or a set of written rules, we can test your bot on your broker’s real costs before you risk money.