Trading costs were the single biggest reason the rules we tested failed, and they did it in three different ways depending on how long a trade was held. Short trades lost to the spread. Long trades lost to overnight financing. In between, costs were small, but the edges were even smaller.
I am Theoneste NZAKIZWANIMANA, founder of TradeLab Research. Over 806 rule settings, 39 classic strategies and 25 suggested improvements, nothing passed our bar. Costs were the main finding behind that result, and this post walks through the exact numbers.
You will also see the broker spreads we measured, a simple way to compute trading costs per trade in R, and a worked example you can copy. Everything here is a historical simulation, not investment advice, and none of it is a recommendation to trade any market.
Table of Contents
Why trading costs decide most backtests
A strategy does not need to be bad to lose money. It only needs an edge smaller than what it pays to trade. That sounds obvious, yet most backtests you see online quietly leave trading costs out, or use a flat spread that is far lower than reality.
We never do that. Every test uses OANDA MetaTrader 5 one-minute prices from 2017 to 2026, with the spread the broker actually recorded at each fill. Orders fill at the next bar’s open, and stops and targets are followed minute by minute. Our how we test page has the full method.
There are three main trading costs for a retail trader: the spread, any commission, and overnight financing, often called swap. Each one scales differently with how long you hold and how tight your stop is. That is why the same broker can be cheap for one strategy and ruinous for another.
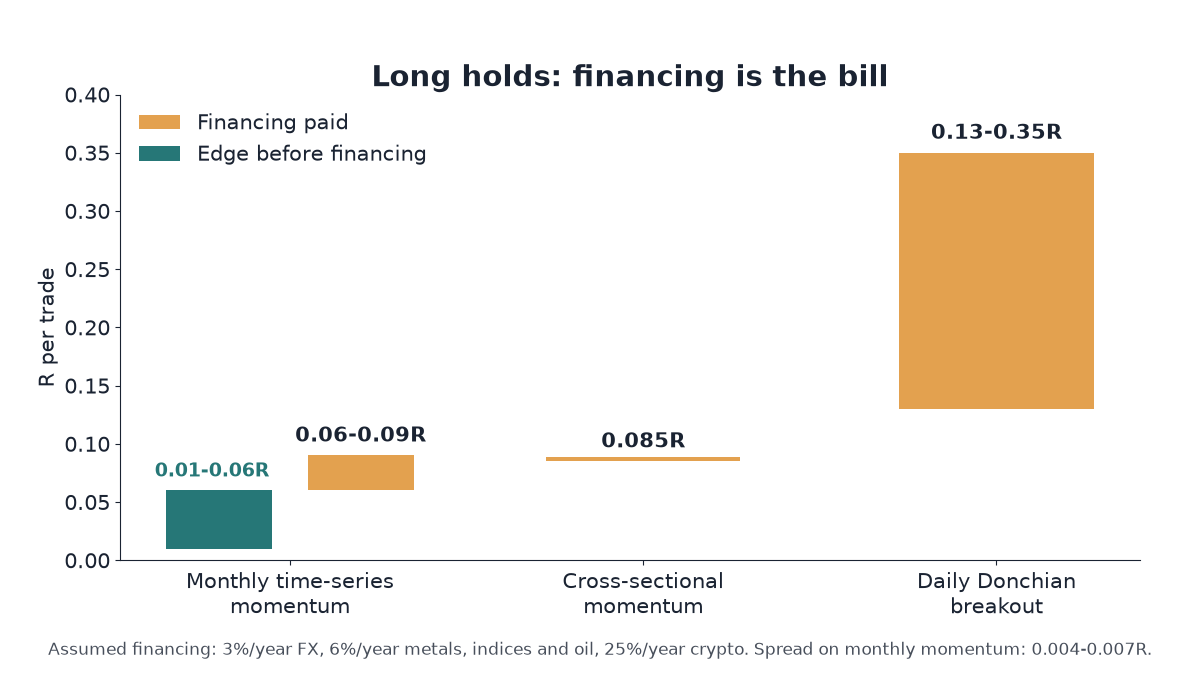
Overnight financing is charged as a stated assumption: 3% a year on FX, 6% a year on metals, indices and oil, and 25% a year on crypto. Results are reported in R, after both spread and financing.
The industry numbers point the same way. Australia’s regulator ASIC found that in FY2024, 68% of retail CFD investors lost money: more than A$458 million in total, including A$73 million in fees. Fees are only one part of trading costs, but they are the part nobody can avoid.
Trading costs in R: the only unit that matters
R is the amount you risk on a trade. If your stop loss would cost you $100, then 1R is $100, a +0.10R result is $10, and a −0.15R result is $15 lost. Measuring trading costs in R lets you compare them directly with the edge, whatever the market or position size.
The key insight is that the same spread costs a different number of R depending on your stop. A tight stop makes every pip of spread a bigger slice of the risk. That is why scalping and short-term strategies feel the spread so much more than swing trades.
How to compute spread cost per trade
You pay the bid-ask spread once per round trip, because you buy at the ask and sell at the bid. In R, the formula is simple:
- Spread cost (R) = spread ÷ stop distance, both in the same units (pips or points).
- Add any commission, converted to the same units, to the spread before you divide.
- Use the spread at the times your strategy actually trades, not the best quote of the day.
How to compute financing cost per trade
Overnight financing is charged on the full position size, not on your risk. That is what makes it dangerous for trades with tight stops held for weeks.
- Financing cost (R) = annual rate × (days held ÷ 365) ÷ stop distance as a fraction of price.
- A stop at 1% of price means the position is 100 times your risk, so a 3% annual rate becomes 3R a year.
- Held for 30 days, that is about 0.25R per trade, before any spread.
Add the costs up per trade
Total trading costs per trade are simply the sum: spread cost plus commission plus financing, all in R. Then compare that total with the edge per trade before costs. If the edge is not clearly bigger, the strategy has nothing left to give you, however good its win rate looks.
Keep the units consistent. Many traders compare a spread in pips with a profit target in dollars, or ignore financing because it shows up as a separate line on the statement. Trading costs only become visible when every part is expressed per trade, in the same R.
Trap 1: the spread kills short-hold strategies
The cleanest example of spread-driven trading costs came from Asian-session FX mean reversion. The idea is simple: during quiet Asian hours, fade moves away from the recent range and expect price to drift back.
Before costs, it worked a little. Across 12 settings, it made +0.04 to +0.11R per trade. But it paid 0.14-0.22R per trade in spread: 0.16R on EURUSD and GBPUSD, and 0.20-0.21R on AUDUSD and GBPJPY. After trading costs, all 12 settings were negative, at −0.07 to −0.17R per trade.
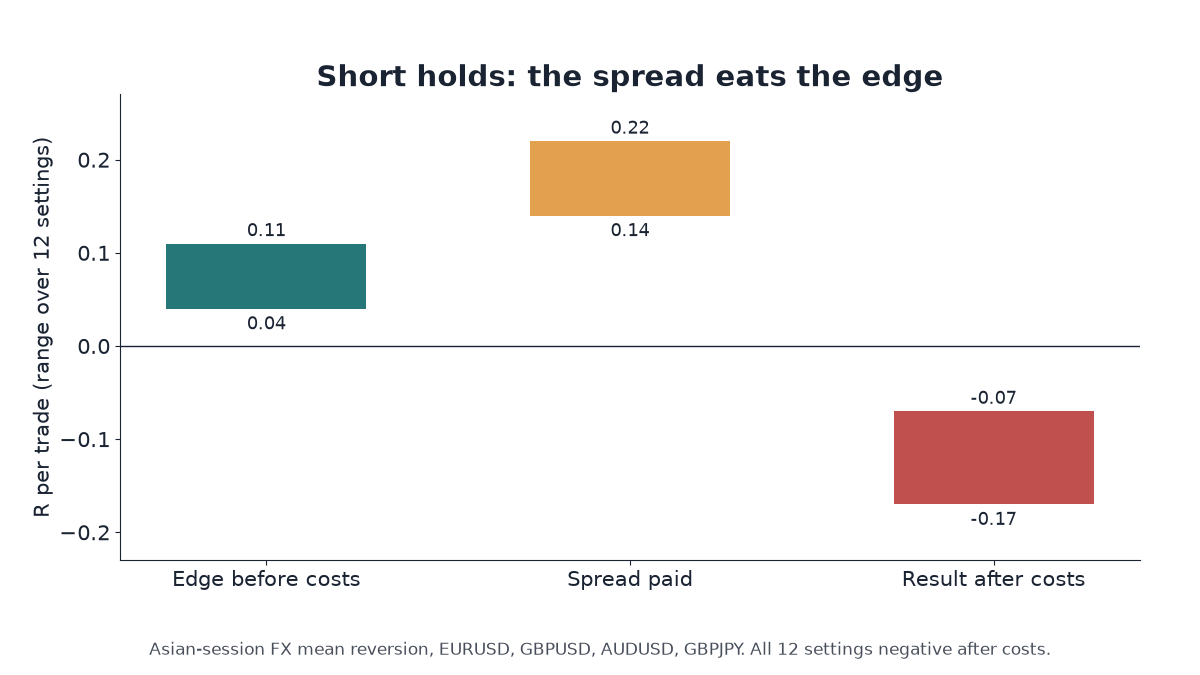
Notice what this means. The pattern was real enough to show up before costs. The problem was that the edge per trade was smaller than the spread per trade, and no amount of discipline fixes that.
The same thing happened with smart money concepts. SMC entries on H1 and M15 paid 0.02-0.25R per trade in spread alone. Our SMC strategy backtest post covers that round, and our post on the forex scalping spread goes deeper on why tight stops and spreads do not mix.
The pattern in 39 strategy reports
The same story ran through our independent assessment of 39 classic strategies. For 32 of them, the signal pointed the wrong way: price reversed right after entry, yet the opposite trade still lost after the spread. That is what trading costs do to a weak signal. They make both directions lose.
The reports suggested keeping more of the edge the spread eats for 15 strategies, and dropping the M15 timeframe for 16. Both are the same advice in different words: trade less often, with wider stops, so trading costs take a smaller bite of each R.
How much cheaper would trading costs need to be?
For the Asian-session rule to break even, its spread costs would have had to fall to about a third of what it paid. That is not a broker discount. That is a different market structure.
Trap 2: financing kills long-hold strategies
With long holds, trading costs flip around. The spread is paid once and becomes tiny, but overnight financing is charged every night the trade stays open.
Monthly time-series momentum is the textbook case. Before financing, it made +0.01 to +0.06R per trade. Its spread was only 0.004-0.007R per trade, almost nothing. But it paid 0.06-0.09R per trade in financing, which was enough to push every setting below zero.
Other long-hold rules paid even more. Daily Donchian breakouts paid 0.13-0.35R per trade in financing. Cross-sectional momentum paid about 0.085R per trade.
Financing also explained the only pass in our 39-strategy assessment. STR-017, a linear regression slope rule on Bitcoin H1, made +0.32R per trade (t 3.1), mostly from long trades while Bitcoin rose about eight times. Once we added 25% a year crypto financing, it no longer passed: its t over 2017-2023 fell to 1.94, under our 2.0 bar.
Our post on swap fees explains how brokers charge overnight financing and why it is so easy to miss. If you hold positions for weeks, financing belongs at the top of your list of trading costs, not at the bottom.
Trap 3: at 1-5 days, trading costs are small but edges are smaller
If short holds lose to the spread and long holds lose to financing, the middle should be the sweet spot. On costs alone, it is. On indices, holds of one to five days paid about 0.005R in spread and 0.005R in financing per trade, roughly 0.01R in total.
The problem was on the other side of the ledger. The reversal rules we tested in that window made at most about +0.008R per trade before costs. Trading costs of 0.01R are tiny, and they were still bigger than the edge.
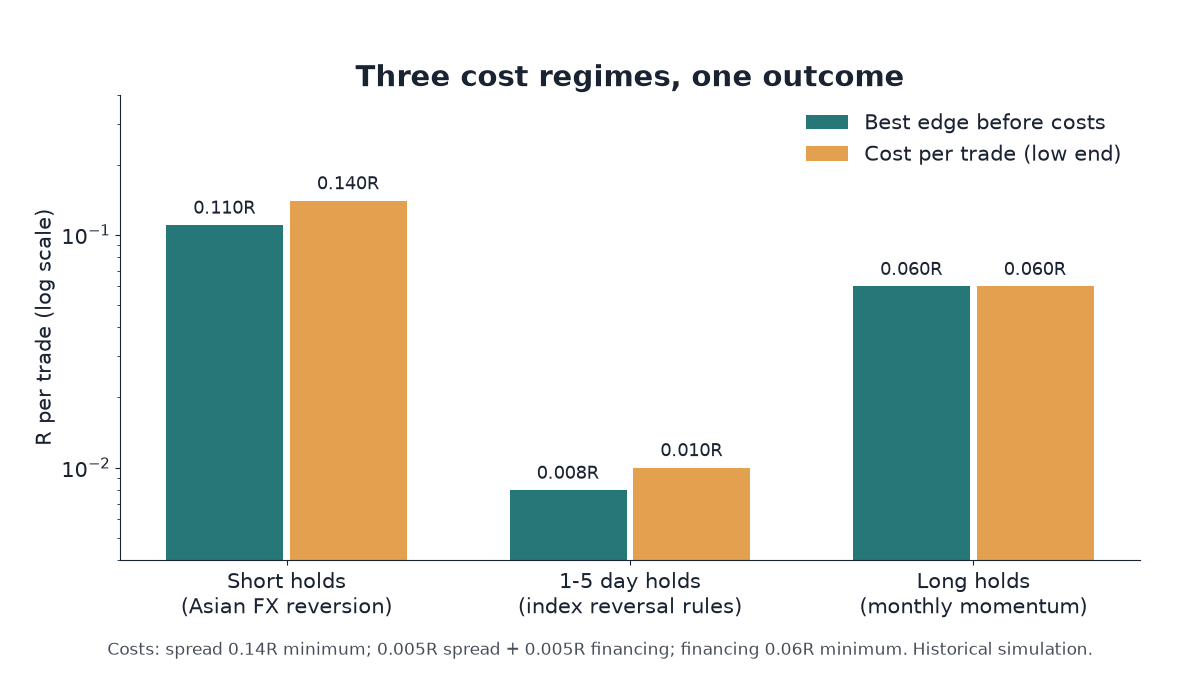
Why is the middle so empty? We have no test that answers that, and I will not guess. What we can say is that trading costs were not the excuse there: at about 0.01R per trade, they were less than a tenth of the 0.14-0.22R that short holds paid in spread.
This is the most sobering of the three traps. It shows that low trading costs are necessary but not sufficient. A cheap market with no edge is still a market with no edge.
Put the three together and a pattern appears across our backtest results: wherever we found a small edge, a cost of the same size was waiting for it.
The broker spreads we measured
Because every test uses the broker’s recorded spread, we can say exactly what those trading costs were. Here are the OANDA medians since 2024, with the 90th percentile in brackets:
- EURUSD: 0.6 pips (0.8)
- AUDUSD: 0.8 pips (1.0)
- GBPUSD: 0.9 pips (1.2)
- Gold (XAUUSD): $0.18 ($0.41)
- US100: 1.8 points (median)
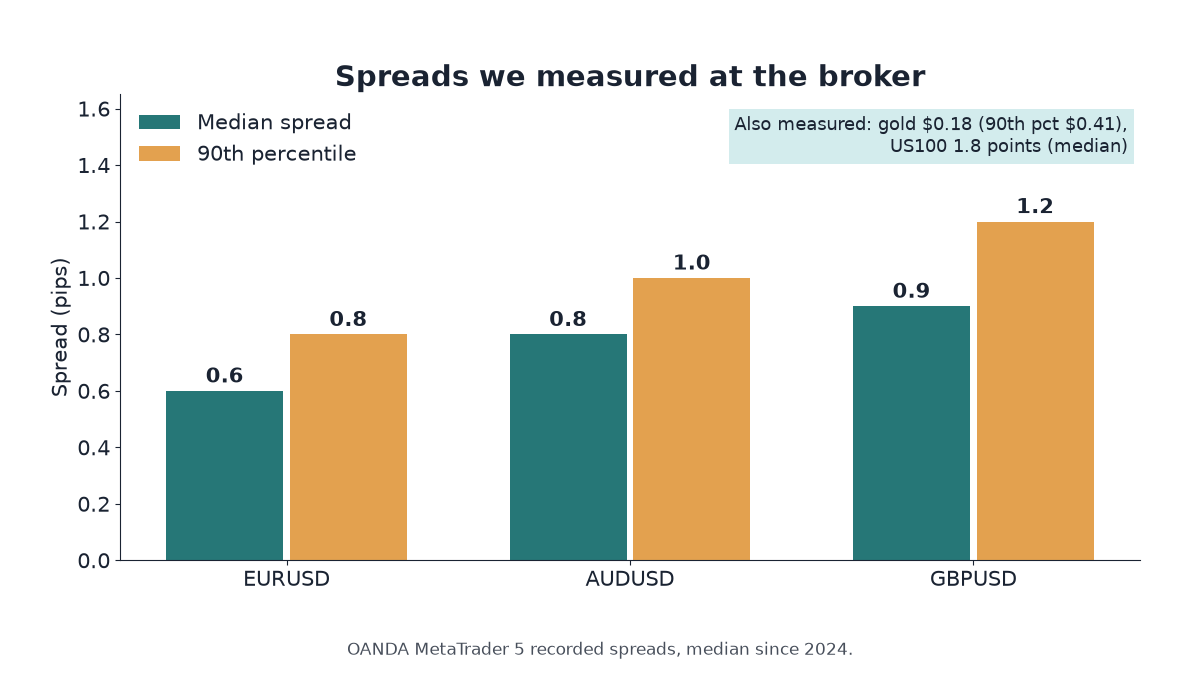
The 90th percentile matters as much as the median. A strategy that trades at quiet hours, around news or at the daily rollover can pay the wider number. That is why we stress-test every pass with 1.5 times the recorded spread.
Raw-spread accounts do not change the picture
A common answer to high trading costs is a raw-spread account with a commission. We checked: at large retail brokers, these cost roughly the same all-in on EURUSD, about 0.6-0.8 pips including a commission of about $3-3.5 per lot per side.
Switching account type moves trading costs from the spread into the commission. It does not make them disappear.
Hidden trading costs inside the backtest itself
Some trading costs never appear on a broker statement, because they hide inside the backtest. They are not fees, but they change results just as much, and they always flatter the strategy.
Optimistic limit fills
In our SMC and MSNR round, 45% of “limit” fills were at a better price than the level itself. A real limit order resting at that level would never have received the better price. Re-pricing those fills to the level turned the best setting from +0.133R per trade to about 0.000R. The entire edge was a fill assumption.
Stops inside the spread
When we checked one strategy library’s backtest engine, we found trades whose stop sat inside the spread at the moment of the fill. Those trades produced meaningless numbers, down to −10^11 R, because the risk was effectively zero. They are now skipped. If your tester allows a stop closer than the spread, its results in R are not reliable.
Same-minute stop and target
If a stop and a target are both hit inside the same minute, one-minute data cannot tell you which came first. We count the stop first. It is a conservative choice, and one more way to keep trading costs and execution honest rather than hopeful.
Check your data’s spread column
One more lesson from our data. The broker export recorded zero spread for whole months of Bitcoin, about 12% of all BTC minutes. A backtest run on that data would have shown trading costs of nothing on those days. We replaced each zero with that month’s median spread. If your backtest software reads spreads from history, open the file and look.
A worked example: trading costs on one strategy
Here is the arithmetic on a made-up EURUSD strategy. The edge and stops below are illustrations, not test results; only the spreads are the measured ones. Suppose the rule makes +0.10R per trade before costs, and you want to know what survives.
| Stop distance | Spread cost at 0.6 pips (median) | At 0.8 pips (90th pct) | At 0.9 pips (1.5 × median) | Edge left at median |
|---|---|---|---|---|
| 5 pips | 0.12R | 0.16R | 0.18R | −0.02R |
| 8 pips | 0.075R | 0.10R | 0.1125R | +0.025R |
| 20 pips | 0.03R | 0.04R | 0.045R | +0.07R |
| 50 pips | 0.012R | 0.016R | 0.018R | +0.088R |
Read the table from top to bottom. With a 5-pip stop, the median spread alone is bigger than the edge. With an 8-pip stop, the rule only survives at the median spread and is wiped out at the 90th percentile. Only with wider stops do trading costs shrink to a small slice of the edge.
Now add financing. Say the 50-pip version is held for 30 days, and the stop is 0.5% of the price. Using our 3% a year FX assumption, financing is 0.03 × 30 ÷ 365 ÷ 0.005, about 0.49R per trade. That is several times the spread cost, and far bigger than the +0.10R edge.
The catch in the worked example
The table assumes the edge stays at +0.10R whatever the stop. In real testing it never does. Change the stop and you change which trades win, how long they last and how much financing they pay. That is why we always re-run the strategy’s own code with the new settings instead of adjusting the old results.
What trading costs mean for choosing a broker and instrument
Here is how I would use these numbers when choosing where and what to trade. None of this makes a strategy work; it only stops trading costs from hiding whether it does.
- Measure trading costs in R before anything else. Divide the real spread by your typical stop. If the answer is close to your expected edge per trade, stop there.
- Match holding time to cost type. Short holds need the tightest spreads you can find. Long holds need the lowest financing, and crypto at 25% a year is especially heavy.
- Use the 90th percentile spread, not the advertised minimum. Your strategy trades when it trades, not when the spread is best.
- Compare all-in costs. Spread plus commission plus financing, per trade, in R. Raw-spread and standard accounts often land in the same place.
- Check costs for the specific hours you trade. Asian-session hours and the daily rollover can look very different from London hours.
- Do not chase cheaper brokers to rescue a weak edge. Our short-hold rule needed costs cut to about a third, which no account type offered.
Programme 2 then tested the same method on Binance USDⓈ-M perpetual futures, where trading costs are lower: a 0.05% fee plus 0.02-0.05% slippage per side, with real 8-hourly funding. Even with those lower trading costs, none of its 52 settings became a candidate.
The academic record is consistent with all of this. In the US, Barber and Odean found that the most active households from 1991 to 1996 earned 11.4% a year against 17.9% for the market. In Brazil, 97% of people who day-traded mini-index futures for 300 or more days lost money. Our retail traders statistics post collects more of these studies.
Key takeaways
- Trading costs come in three shapes: spread on short holds, financing on long holds, and edges smaller than costs at 1-5 days.
- Asian-session FX reversion made +0.04 to +0.11R before costs, paid 0.14-0.22R in spread, and lost in all 12 settings.
- Monthly momentum made +0.01 to +0.06R before financing and paid 0.06-0.09R per trade to hold.
- At 1-5 days, costs of about 0.01R still beat edges of at most about 0.008R.
- Measured OANDA medians: EURUSD 0.6, AUDUSD 0.8, GBPUSD 0.9 pips; gold $0.18; US100 1.8 points.
- Spread cost in R is spread ÷ stop; financing in R is rate × time ÷ stop as a fraction of price.
- Raw-spread accounts cost about the same all-in, so a cheaper account rarely saves a weak edge.
- Hidden trading costs inside a backtest, such as optimistic limit fills, can be as large as the whole edge.
These figures are historical simulations, not investment advice. To see how we build trading costs into every test, read how we test. If you want your own bot checked with your broker’s real spreads and financing, get your bot tested.