
Can an SMC strategy survive a strict, rules-first backtest with real broker spreads? We wanted a straight answer, so we turned Smart Money Concepts and Malaysian SnR (MSNR) into mechanical rules and tested 34 settings on 7 markets. I am Theoneste NZAKIZWANIMANA, founder of TradeLab Research, and this post walks through what we built, what we found and what surprised us.
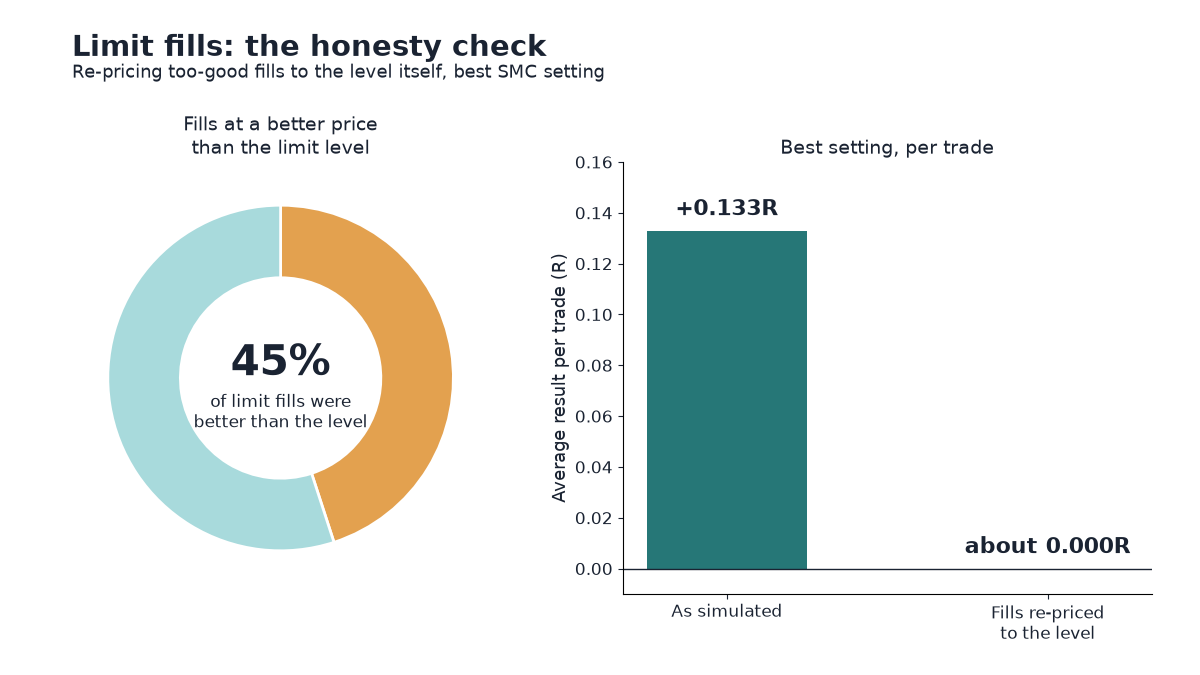
The short version: no setting came close to our pass bar. The best single setting reached a t-statistic of 1.05 when we needed 2.5. Then a simple honesty check on limit-order fills took the best result from +0.133R per trade to about zero.
This is not a verdict on the traders who use these ideas. A discretionary SMC strategy carries judgement that code cannot copy. It is a report on one careful mechanical reading of the concepts, run the same way we run every test. Everything below is a historical simulation, not investment advice.
Table of Contents
What an SMC strategy looks like when it has to be code
On a chart, SMC is a language. Traders talk about levels, structure, order blocks, imbalances and liquidity. A person can look at a chart and say “that is a clean order block in a bullish storyline” in two seconds. A computer needs every word in that sentence defined first.
So the first job in building a testable SMC strategy was translation. We wrote down a definition for each concept, hashed the rules with SHA-256 and only then ran the test. That pre-registration matters: it stops us from quietly changing a definition after seeing the results. Any correction became a dated amendment, never a silent edit.
Levels from candle bodies (Malaysian SnR)
Malaysian SnR draws levels from candle bodies, not wicks. Our SMC strategy rules used the three classic MSNR level types: the A-level, the V-level and the gap level, all taken from bodies. A level counted as fresh until price first touched it. After the first touch it was no longer fresh.
Freshness sounds simple, yet it is one of the places where traders disagree most. Some count a wick touch, some only a close. We picked one definition, wrote it down before the run, and kept it fixed.
Storyline from break of structure and change of character
Every SMC strategy needs a “storyline”: which side is in control. We built it on the higher timeframe from break of structure (BOS) and change of character (CHoCH). A BOS in the direction of the trend kept the storyline. A CHoCH, the first break against it, flipped it. The storyline set the context for every entry on the lower timeframe.
We tested two timeframe pairs. H1 entries took their context from H4, and M15 entries took their context from H1. This is the classic top-down approach many SMC traders describe.
Entries: order blocks, fair value gaps, quasimodo and sweeps
The entry layer of our SMC strategy combined the ideas traders use to time a trade at a level:
- Order blocks as zones where an entry can sit.
- Fair value gaps (FVGs), the three-candle imbalances, as confluence.
- Quasimodo patterns, the over-and-under structure around a level.
- Liquidity sweeps, where price runs past a level to take resting stops before reversing.
In total we tested 34 settings of the SMC strategy, each on the same 7 markets: US500, US100, US30, gold, EURUSD, GBPUSD and BTCUSD.
How we tested the SMC strategy rules
The SMC strategy test used the same method as every TradeLab study, explained in full on our how we test page. The strategy’s own code decides every trade. Everything else is checked from the outside, with nothing hand-picked.
- Data: OANDA MetaTrader 5 one-minute prices, 2017-2026, with the broker’s recorded spread at each fill.
- Fills: at the next bar’s open. Stops and targets were followed minute by minute. If both were hit in the same minute, the stop counted first.
- Units: results in R, where 1R is the amount risked, after spread and overnight financing.
Time was split into three periods. SEARCH ran from mid-2017 to the end of 2022, and tuning was allowed there. VALIDATION covers 2023-2024 and is run once on frozen candidates. A LOCKBOX from 2025 stays sealed. You can read why this order matters in our post on out-of-sample testing.
To leave SEARCH, a setting needed a t-statistic of at least 2.5 on 200 or more trades. It also had to be positive on at least two thirds of markets and sit on a “plateau”, meaning its neighbouring settings were positive too. Those rules protect against overfitting, the habit of fitting noise instead of a real pattern.
Any SMC strategy setting that made it out of SEARCH would then face VALIDATION. There it needed a t-statistic of at least 2.0 on 100 or more trades. It also had to beat 95% of 200 “coin-flip” runs, which use the same entry times and stop and target distances but a random direction. Finally, it had to stay positive with 1.5 times the spread.
That is a demanding bar on purpose. A real edge should clear it. A lucky pattern usually does not, and it is far cheaper to learn that in a simulation than with real money.
SMC strategy backtest results: 34 settings, best t 1.05
| Item | SMC strategy study |
|---|---|
| Settings tested | 34 |
| Markets | US500, US100, US30, gold, EURUSD, GBPUSD, BTCUSD |
| Entry / context timeframes | H1 with H4, M15 with H1 |
| Best plateau t-statistic | 0.65 |
| Best single setting t-statistic | 1.05 |
| t-statistic needed | 2.5 |
| Limit fills better than the level | 45% |
| Best setting, fills re-priced | +0.133R to about 0.000R |
In plain words: across 34 settings, the best plateau reached a t-statistic of 0.65. The best single setting reached 1.05. The bar to move on to VALIDATION was 2.5. No setting of the SMC strategy got close, so none was ever run on the 2023-2024 data.
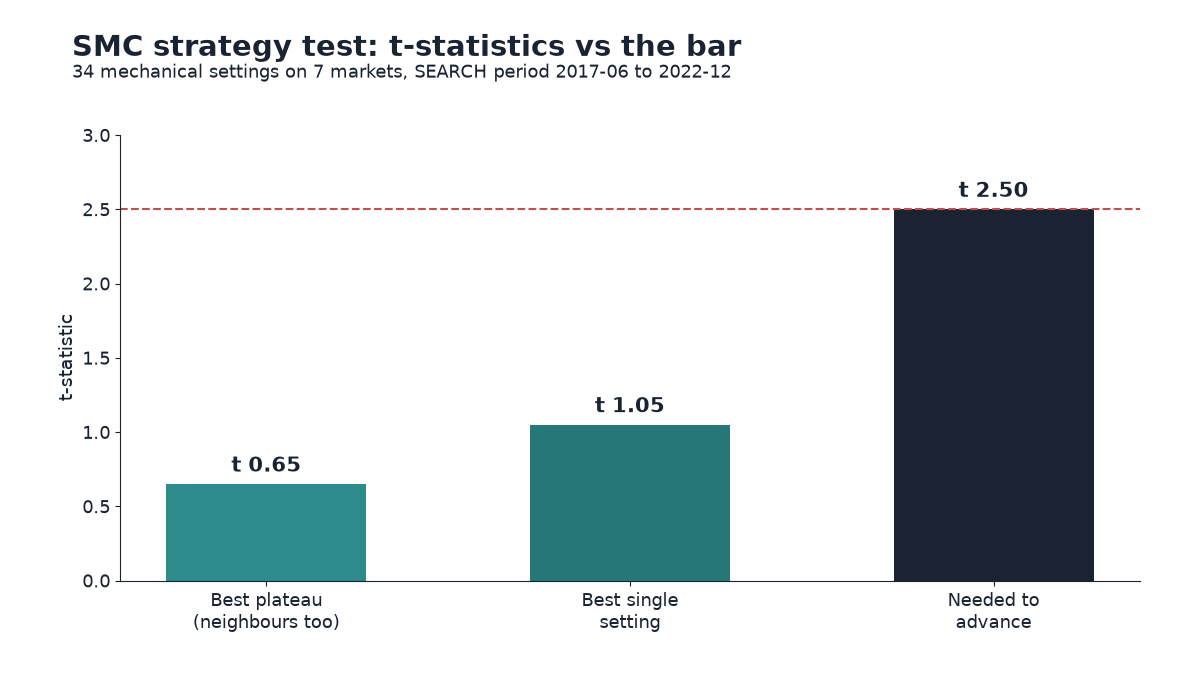
What does a t of 1.05 mean in plain terms? It measures how far the average result sits from zero compared with the noise around it. Values near 1 are what random luck produces all the time. When you test 34 settings, one of them landing near 1 is expected even if none of them has any edge.
That is the multiple comparisons problem. The more versions you try, the better the best one looks by chance. It is why we set the bar at 2.5 in SEARCH and require neighbours to agree. A lone good setting surrounded by poor ones is almost always luck. Our luck test post shows how we check this with coin-flip runs.
The limit-order honesty check
Even the weak numbers above flattered the SMC strategy. The reason is a quiet problem in how backtests fill limit orders, and it is worth understanding if you test anything that enters at a level.
An SMC entry usually rests a limit order at a level, an order block edge or the middle of a gap. When we checked the fills, 45% of the “limit” fills were at a better price than the level itself. This can happen when the simulator sees the touch and fills at the next bar’s open, which has already moved past the level.
A real limit order sitting at the level would have filled at the level, not beyond it. So we re-priced those fills to the level itself. The best setting went from +0.133R per trade to about 0.000R. All of its apparent edge came from fills a live order would never have received.
This is one of the most useful lessons from the whole study. If you backtest your own SMC strategy, look at your fills. Ask whether each entry price is one a resting order could really have got. A few ticks per trade can be the entire result.
Tight stops and the spread at the fill
A related trap showed up in our library study. TradeLab’s own backtest engine agreed with our independent simulator, but we found one issue: some trades had a stop that sat inside the spread at the moment of the fill. Their results in R were meaningless, as low as −10^11 R. Those trades are now skipped.
Any SMC strategy that uses very tight stops below an order block or a sweep wick can hit the same problem. If the stop is closer than the spread, the trade is lost before it starts, and the R figure tells you nothing useful.
The fair value gap definition problem
Fair value gaps caused a different kind of trouble for the SMC strategy code. Most traders treat an FVG as “filled” once price comes back into it. When we coded that literally, gaps lived only about 2 bars. Price nearly always pokes into a fresh gap almost at once, so almost no gap survived long enough to be used.
We had to define a gap as filled only when price trades through the whole gap. With that rule, gaps lasted long enough to act as confluence. But notice what happened: a concept that looks obvious on a chart needed a judgement call before it could be tested at all.
This is not a flaw in the traders who use FVGs. It is a warning about any SMC strategy you try to automate. Small definition choices change which trades exist. If two coders read “fair value gap” differently, they are testing two different strategies.
What the spread takes from each SMC strategy trade
Costs are where many intraday ideas quietly die, and this SMC strategy was no exception. Our SMC entries on H1 and M15 paid between 0.02R and 0.25R per trade in spread. The range is wide because spreads differ by market and stop sizes vary from trade to trade. A tight stop on M15 makes the same spread a much bigger share of 1R.
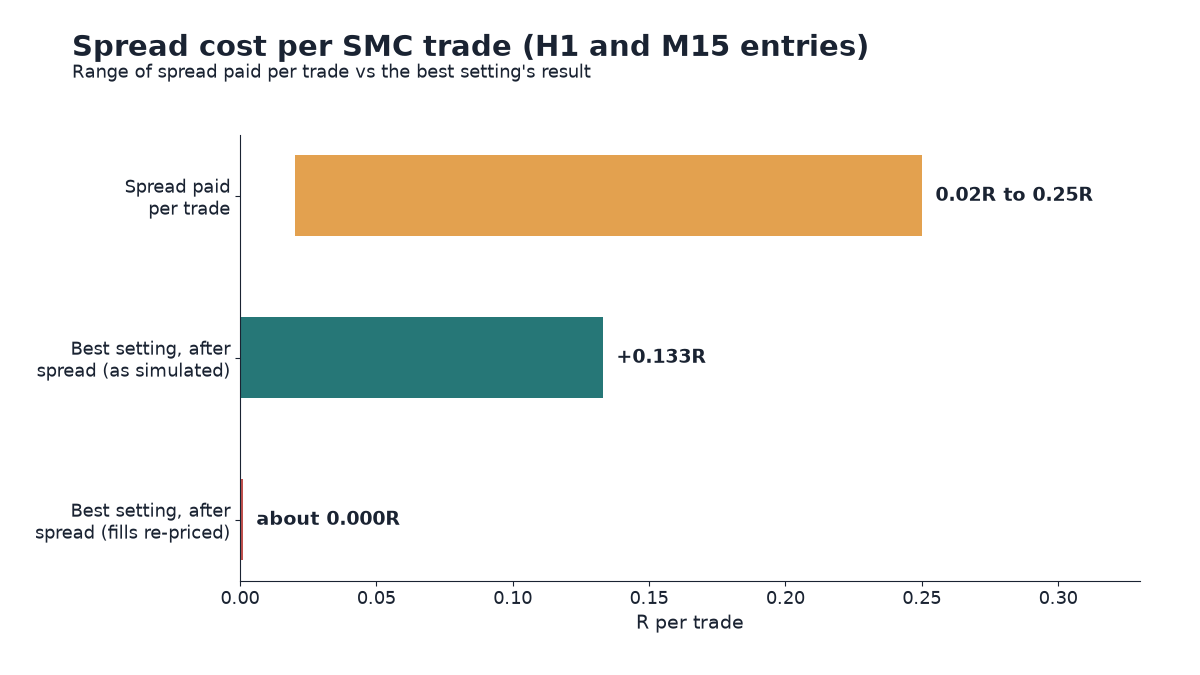
To put that in context, the best setting earned +0.133R per trade after spread, before the fill check. A cost of up to 0.25R per trade is bigger than that whole result. On OANDA since 2024, the median spread we measured was 0.6 pips on EURUSD and 1.8 points on US100. Those look small on a chart, but they are large next to a tight stop.
We wrote a whole post on this effect for short holds: why forex scalping loses to the spread. The same arithmetic applies to any SMC strategy on lower timeframes. More detail on how we model spread and financing is in our guide to trading costs.
One more data lesson came from BTCUSD, one of our 7 markets. The broker export recorded a spread of zero for whole months of Bitcoin, about 12% of all BTC minutes. We replaced each zero with that month’s median spread. If you backtest an SMC strategy on crypto, check the spread column in your data before you trust any result.
The library’s SMC-style strategies failed too
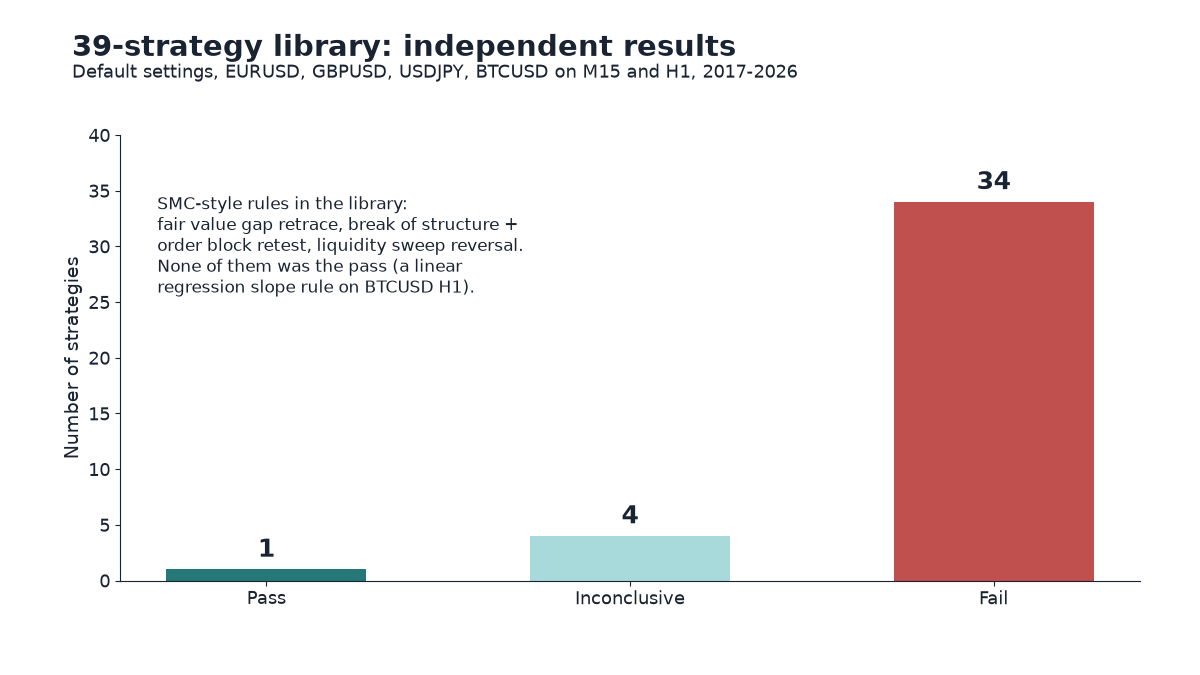
The 34-setting study was not our only SMC strategy test. In a separate project we independently tested a library of 39 registered strategies on EURUSD, GBPUSD, USDJPY and BTCUSD, on M15 and H1, from 2017 to 2026, with default parameters only.
Three of them were clearly SMC-style: a fair value gap retrace, a break of structure plus order block retest, and a liquidity sweep reversal. None of the three passed. The library as a whole produced 1 pass, 4 inconclusive results and 34 fails. The only pass was a linear regression slope rule on BTCUSD H1.
Across the 39 reports, the most common finding was that the signal pointed the wrong way: in 32 strategies, price reversed soon after entry. Yet the opposite trade still lost after the spread. That pattern matters for anyone who hopes to “just flip” a losing SMC strategy.
Our wider edge search went further still: 806 rule settings across 38 families, including H4 structure with an M15 break of structure and liquidity sweeps versus clean breaks. It produced zero valid passes. You can see the full picture in our backtest results summary.
What an SMC strategy trader can take from this
What this test does not prove
Our result does not prove that no SMC strategy can ever work. It shows that 34 careful mechanical versions, tested with real spreads and honest fills, found no edge. A different definition of an order block or a fresh level would be a different SMC strategy, and it would need its own test with its own written rules.
Lessons for your own trading
I want to be fair to SMC traders here. Our test checks one mechanical reading of the concepts. A skilled discretionary trader may filter setups in ways no rule set captures. Still, the study gives a few practical lessons for anyone trading an SMC strategy by hand or by code.
- Write your definitions down. If you cannot say exactly what makes a level fresh or a gap filled, you cannot test it, and you cannot trust your memory of past trades.
- Check your fills. If your entries are limit orders, make sure your backtest fills at the level, not beyond it.
- Measure the spread in R. On M15 and H1, the spread can take a large slice of each trade.
- Be wary of the best of many. If you tried many versions, the best one is likely flattered by luck.
There is also a wider context. EU regulators’ studies cited by ESMA found that 74-89% of retail CFD accounts lost money. In a 2016 sample, the UK FCA found 82% of clients lost money on CFDs. Costs and noise are a big part of that picture. A clear, tested process is the best defence any SMC strategy trader has.
Questions to ask before you trust an SMC strategy backtest
Whether the backtest is yours, a vendor’s or a course’s, a few questions sort the careful tests from the hopeful ones:
- Were the rules and the settings written down before the test was run?
- Does the result include the broker’s real spread at each fill, and financing for trades held overnight?
- Are limit entries filled at the level, or at a better price no live order would get?
- How many versions of the SMC strategy were tried before the one being shown?
- Was the final result checked on later data that played no part in the tuning?
- Does it beat random entries with the same stops and targets?
If the answer to most of these is “no” or “not sure”, treat the equity curve as a hypothesis, not a result.
If you run an SMC strategy as an expert advisor or a Python bot, an outside test can show what it really does after costs. Our bot testing service runs your own code on years of broker data with your broker’s costs, and reports the results by market and period.
Key takeaways
- We coded an SMC strategy with Malaysian SnR into fixed rules and tested 34 settings on 7 markets.
- The best plateau reached t 0.65 and the best single setting t 1.05; the bar was 2.5.
- 45% of limit fills were better than the level; re-pricing them took the best setting from +0.133R to about 0.000R.
- Fair value gaps needed a “full fill” definition, or they lived only about 2 bars.
- Spread on H1 and M15 entries cost 0.02R to 0.25R per trade.
- The library’s fair value gap, order block and liquidity sweep strategies did not pass either.
- If you trade an SMC strategy, write the rules down, check your fills and measure the spread in R.
None of this says SMC traders are wrong to use structure and levels to read a chart. It says that this SMC strategy, written as rules and tested honestly, showed no edge after costs. If you want to see exactly how we test, read our method. If you have a bot of your own, you can get it tested the same way.