Most retail traders lose money, and that is not an opinion: it is what regulators, academics and prop firms report every time they open their books. I am Theoneste NZAKIZWANIMANA, founder of TradeLab Research, and I spend my days testing trading rules on years of broker data. In this post I collect seven large studies, compare them with what our own testing found, and look at what separates the few who last.
This is not a post to scare anyone away. It is a post about base rates. If you know that most retail traders lose, you can ask a better question: what would I need to do differently from the majority? The numbers below give a clear answer, and most of it is about costs, size and honest testing.
I also want to be fair to retail traders. Many of them are careful, curious people who read a lot and practise hard. The studies do not say they are foolish. They say the game is built so that the average participant pays more than they earn, and effort alone does not change that.
Table of Contents
What the biggest studies say about retail traders
Before the details, here is the whole picture for retail traders in one table. The studies come from different countries, different decades and different products, yet they point the same way. Each row links to its source further down.
| Study | Who was measured | What they found |
|---|---|---|
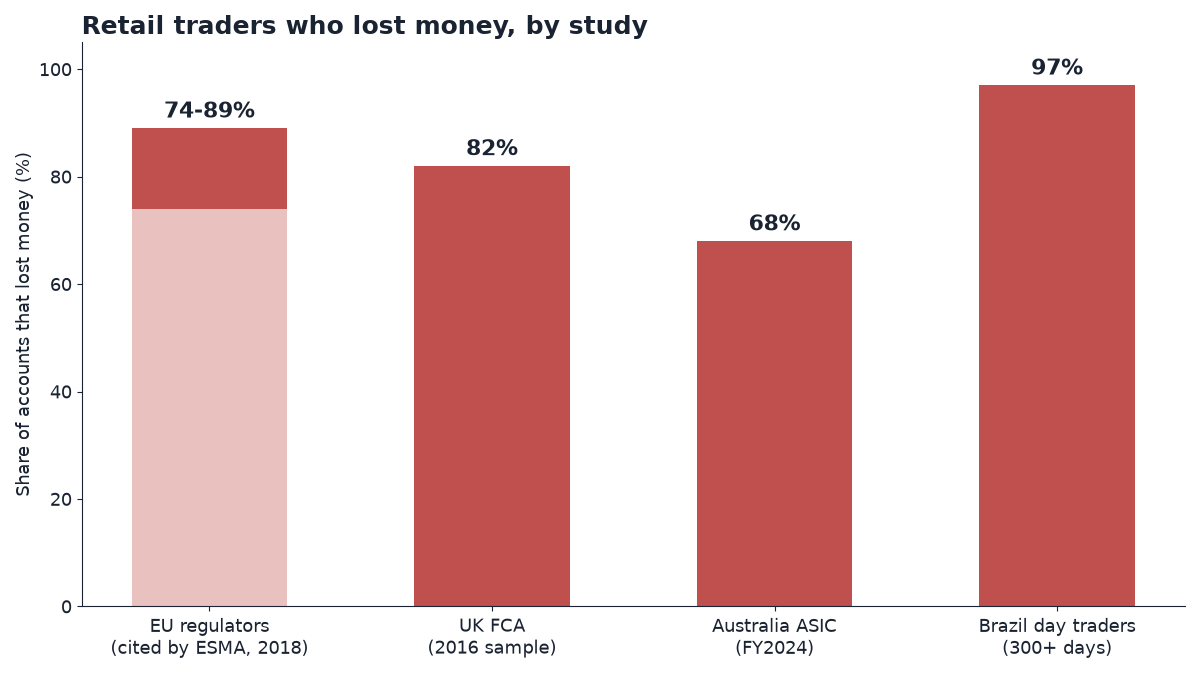
| EU regulators, cited by ESMA (2018) | Retail CFD accounts | 74-89% lost money |
| UK FCA (2016) | Retail CFD clients | 82% lost money |
| Australia ASIC (FY2024) | Retail CFD investors | 68% lost money |
| Taiwan (1992-2006) | Day traders | Less than 1% predictably profitable after fees |
| Brazil | Mini-index futures day traders, 300+ days | 97% lost money |
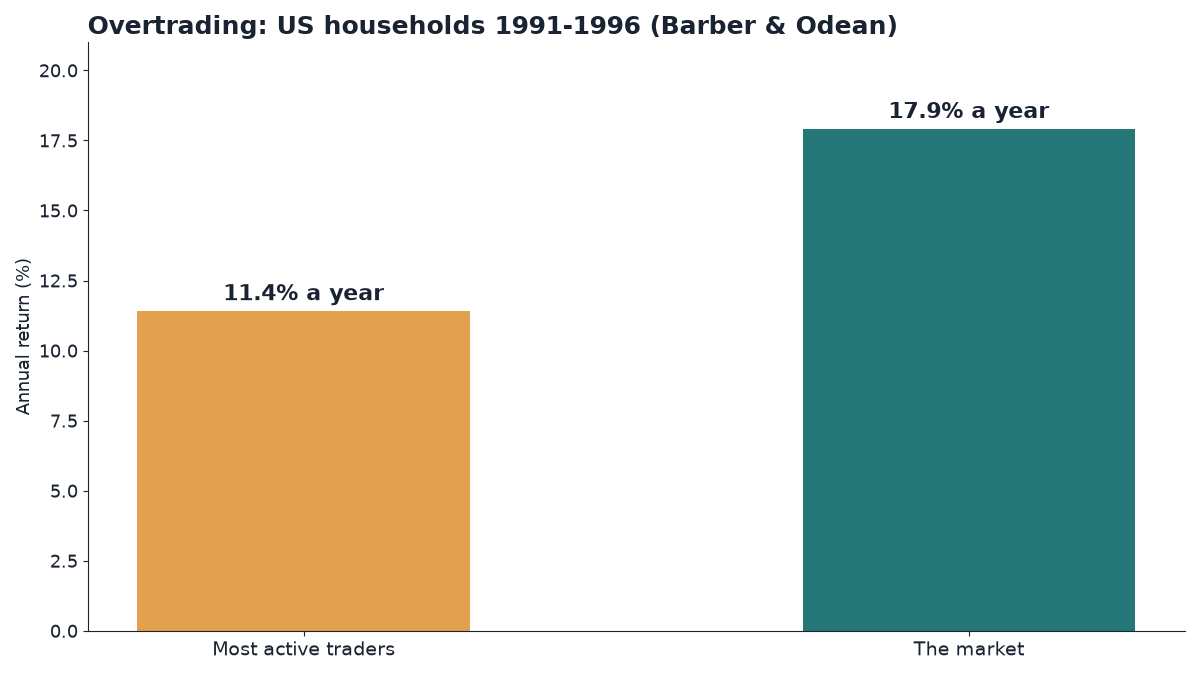
| US households (1991-1996) | Most active traders | 11.4% a year vs 17.9% for the market |
| Prop-firm challenges | 300,000+ accounts | About 7% ever received a payout |
Europe: 74-89% of retail CFD accounts lost money
In 2018 the European Securities and Markets Authority (ESMA) cited studies by national regulators. Those studies found that 74-89% of retail CFD accounts lost money. The average loss per client ranged from EUR 1,600 to EUR 29,000, depending on the country.
That range matters. Even the best national figure still means about three in four retail traders finished behind. The losses were not small slips either; tens of thousands of euros is a serious amount for most households.
United Kingdom: 82% of CFD clients lost money
The UK Financial Conduct Authority looked at a sample of client accounts in 2016 and found that 82% of clients lost money on CFDs.
Australia: 68% of retail CFD investors lost money in FY2024
The Australian regulator ASIC reported that in FY2024, 68% of retail CFD investors lost money. The total came to more than A$458 million, including A$73 million in fees. That last number is worth reading twice: a sizeable part of what retail traders lost went straight to costs.
Day trading data: how many retail traders win over years
Snapshots of one year can hide something. Some people lose for a year and then improve, others get lucky for a year and then give it back. The strongest evidence therefore comes from studies that follow day traders over long periods. Two of them stand out.
Taiwan: less than 1% predictably profitable
Barber, Lee, Liu and Odean studied day traders in Taiwan from 1992 to 2006, fifteen years of trading records. They found that less than 1% of day traders were predictably profitable after fees. Note the word “predictably”: a single good year does not count; what counts is whether it repeats.
This is the most useful number for retail traders who had a winning month and wonder if they have found something. A short winning streak is common. A record that keeps beating costs year after year is rare.
Brazil: 97% of persistent day traders lost money
Chague, De-Losso and Giovannetti followed Brazilians who day-traded mini-index futures. Of the 1,551 people who kept at it for more than 300 days, 97% lost money. These were not retail traders who tried once and quit. They were the persistent ones, and persistence did not save them.
Overtrading: why active retail traders earn less
Barber and Odean’s paper “Trading Is Hazardous to Your Wealth” (2000) studied US households from 1991 to 1996. The most active traders earned 11.4% a year, while the market returned 17.9%. They did not lose money in absolute terms in a strong market, but they kept far less than if they had traded less.
The pattern is simple. Every trade costs something, and every extra trade adds a fresh chance to be wrong. When the edge per trade is zero or tiny, more trades just mean more costs. Overtrading turns a small problem into a large one.
Why retail traders keep trading anyway
If the numbers are this clear, why do retail traders keep pressing the button? Part of the answer is that trading feels like work. Watching charts, drawing levels and taking a position all feel productive, while waiting feels like doing nothing. Yet in the Barber and Odean data, the households that did the most did the worst.
The other part is memory. A big win is vivid and easy to recall. Fifty small losses, each just a little spread and a little slippage, leave no picture at all. Retail traders tend to remember the trade, not the cost of the trade, and the cost is where the money quietly leaks.
A third reason is the stories people hear. Screenshots of winning days travel far; quiet losing months do not. The regulators’ numbers are the antidote, because they count every account, not just the ones that make a good post.
Prop-firm challenges: about 7% of retail traders reach a payout
Prop-firm challenges are the newest version of the same story for retail traders. You pay a fee, trade a demo or funded account under strict loss limits, and receive a share of profits if you pass. In one dataset of more than 300,000 accounts, only about 7% of traders ever received a payout.
That does not mean 7% are skilled. Some of them were lucky, and a challenge with a fixed target rewards variance as much as skill. It does mean that roughly 93 out of 100 retail traders paid the fee and got nothing back.
For retail traders, the lesson is about variance. A challenge with a tight drawdown limit punishes normal bad streaks, even for a rule with a small real edge. Before you pay for one, ask how often a random strategy with the same size and stop would pass. That number is rarely zero, which tells you how much of a pass is noise.
What our own 806-setting search adds
Studies of real accounts tell you that most retail traders lose. They do not tell you why. That is where our own work comes in. At TradeLab Research we test trading rules from the outside, on broker data, with honest costs, and we write the rules and the pass bar down before each run.
Our largest project so far was an edge search: 6 rounds, 38 families of rules and 806 settings in total. It covered intraday momentum, opening-range breakouts, turn of the month, Williams volatility breakouts, liquidity sweeps, SMC structure, round numbers, crypto intraday and many more. You can read the full method on our how we test page.
The data was OANDA MetaTrader 5 one-minute prices from 2017 to 2026, with the broker’s recorded spread at each fill. Fills happened at the next bar’s open, and if a stop and a target were hit in the same minute, the stop counted first.
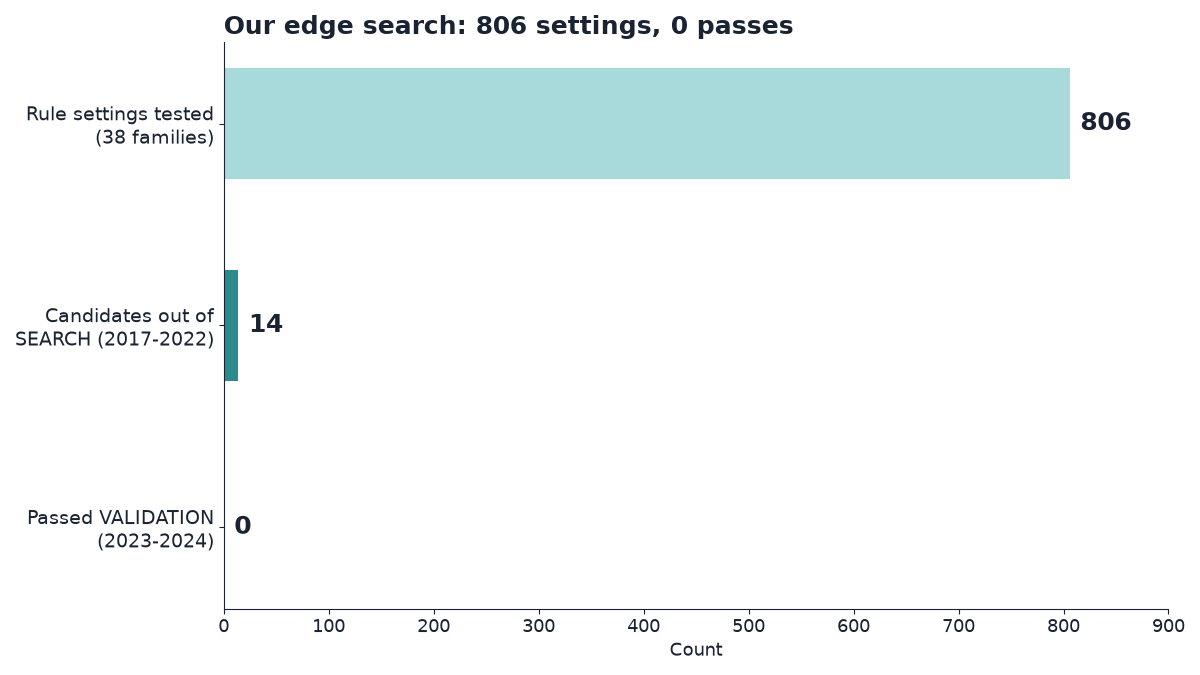
The result: 806 settings, 14 candidates made it out of the search period (2017-2022), and none of them survived the validation period (2023-2024). The best candidate of round 2, a trend-day continuation rule on US indices, made +0.13R per trade in search and −0.022R per trade in validation. You can see more of these numbers in our backtest results post.
Short holds lose to the spread
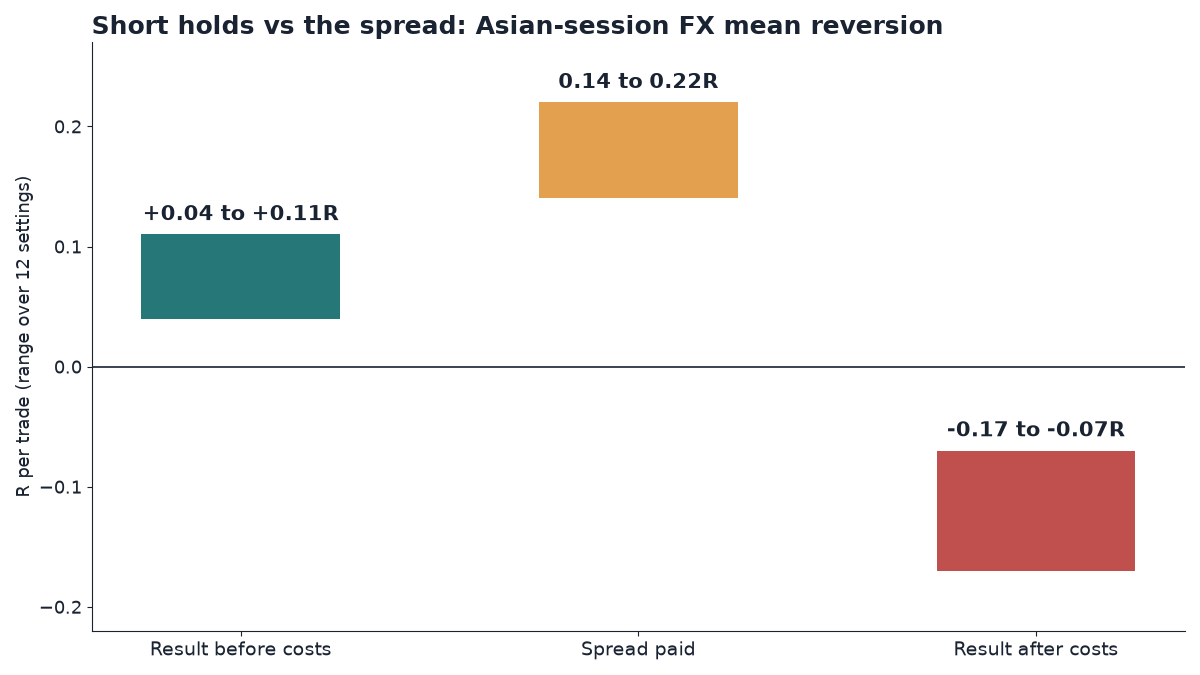
The clearest lesson was about costs. Asian-session FX mean reversion made +0.04 to +0.11R per trade before costs. It then paid 0.14 to 0.22R per trade in spread. All 12 settings were negative after costs, between −0.07 and −0.17R per trade.
In plain words, the idea was not empty: price did tend to come back. The bid-ask spread was simply bigger than the edge. This is exactly the trap many retail traders walk into with scalping, and we explain it in detail in our forex scalping and spread post.
Long holds lose to financing
Holding longer does not escape costs; it swaps one cost for another. Monthly time-series momentum made +0.01 to +0.06R per trade before financing and turned negative after it. Financing took 0.06 to 0.09R per trade, while the spread took only 0.004 to 0.007R. A daily Donchian breakout paid 0.13 to 0.35R per trade in overnight financing.
Our swap fees post shows how quickly overnight charges add up. Between the two extremes, 1-5 day holds had small costs, but the edges we found there were smaller still.
Why costs decide so much for retail traders
Put the regulators’ numbers next to our test numbers and the link is hard to miss. ASIC counted A$73 million in fees inside A$458 million of losses. Barber and Odean found that the most active retail traders kept the least. Our search found ideas that were positive before costs and negative after them.
The broker costs we measured are not outrageous. Since 2024 the median spread at OANDA was 0.6 pips on EURUSD, 0.9 on GBPUSD, 0.8 on AUDUSD, $0.18 on gold and 1.8 points on US100. Raw-spread accounts at large retail brokers cost roughly the same all-in on EURUSD, about 0.6-0.8 pips including commission.
The problem is that many retail traders aim for small moves. A short-hold strategy in our tests needed its costs cut to about a third. No retail account offers that. So the honest answer to “why do retail traders lose?” is often not psychology at all. It is arithmetic. Our trading costs post goes through that arithmetic step by step.
A cost check every retail trader can do
You do not need our data to run the same check. Take your last 50 trades. For each one, write down the spread and commission you paid and any overnight financing, then divide by the amount you risked. That gives the cost per trade in R.
Now compare it with your average result per trade before costs. If costs are a large share of it, small changes in the market will push you below zero. Most retail traders who try this are surprised by how big the cost column is.
The luck problem hides the cost problem
There is a second reason the numbers stay so bad. When retail traders, or researchers, test many ideas, some look good by chance. Statisticians call this the multiple comparisons problem, and in trading it shows up as overfitting: a rule tuned to the past that fails on new data.
That is why we run 200 coin-flip versions of every result, with the same entry times and the same stop and target distances but a random direction. A rule must beat 95% of them. Our luck test post explains why so many “edges” disappear under this check.
What separates the few retail traders who last
The studies show a small group of retail traders who do not lose, or who at least survive long enough to learn. Nothing in our data proves any single habit makes money. But the patterns in the studies and in our tests point to a handful of habits that reduce damage.
- Small size. If most rules have little or no edge after costs, the first job is to survive. Small positions keep a bad month from ending the account.
- A measured edge, not a feeling. A winning streak is common; a result that beats random entries on data it has never seen is rare. Measure before you trust.
- Cost awareness. Know your spread, commission and overnight financing per trade, in R. If the expected edge is smaller than the costs, the trade is negative before it starts.
- Honest testing. Write the rules and the pass bar down before you test. Keep a period of data you never touch while tuning. Our out-of-sample testing post shows how.
- Journaling. Record every trade, the reason for it and the cost of it. A journal turns vague memories into numbers you can check.
Habits that make it worse
The same evidence also points to habits that make losses bigger. Trading more often after a loss multiplies costs. Doubling up to win back losses, the martingale) pattern, turns a slow decline into a fast one. Trusting a backtest without costs, or one that was tuned on all the data, hides the truth until real money finds it.
Realistic alternatives for retail traders
If the base rate is this harsh, what should curious retail traders do? I cannot tell you to trade or not to trade, and nothing here is investment advice. All our results are historical simulations. But there are realistic ways to keep learning without paying the full price of the majority.
- Test before you trade. Paper-trade a rule with fixed rules for months. We do the same: our three near misses are only in forward paper testing until 2027-11-30, not live.
- Trade less often. Barber and Odean’s benchmark was simply the market. Fewer, larger-edge decisions cost less than many small ones.
- Get your bot checked. If you run an expert advisor or a Python bot, an independent test on your broker’s costs often finds bugs, missing timeouts or results that depend on one market. That is what our bot testing service does.
- Treat it as research. Most of what we learned came from failures. A failed test that you understand is worth more than a lucky month you do not.
What our client tests usually show
Clients send us MT5 expert advisors, Python code or written rules. The typical findings are no edge after costs, trades the code takes that the written rules never intended (such as duplicate signals), and results that depend on one market or one period. These are the same three problems the industry statistics hint at. You can read more in our trading bot review post.
Retail traders and crypto: the same pattern
Crypto is often sold as the place where retail traders finally have an edge. Our tests did not find one there either. A Bitcoin rule that passed our library test lost its pass once realistic financing of 25% a year was added. I wrote the whole story up in our crypto trading strategy post.
Key takeaways
- Large studies agree: 74-89% (EU), 82% (UK) and 68% (Australia) of retail CFD accounts lost money; 97% of persistent Brazilian day traders lost; under 1% of Taiwanese day traders were predictably profitable.
- Overtrading hurts: the most active US households earned 11.4% a year against 17.9% for the market.
- About 7% of prop-challenge traders in one large dataset ever received a payout.
- Our own search of 806 settings found 0 passes, and costs were the main reason, just as they are for many retail traders: spread for short holds, financing for long holds.
- The habits that help retail traders last are small size, a measured edge, cost awareness, honest testing and a journal.
Every number in this post is either from a published study or from our own historical simulations; none of it is a promise or investment advice. If you want to see exactly how we test, read our method. If you have a bot or a set of rules and want an honest answer before you risk money, you can get your bot tested.