
A luck test is the simplest way I know to find out whether a trading strategy has real skill or simply caught a good run of prices. Most traders never run one. They look at a rising equity curve, see a decent win rate and assume the rules did the work.
At TradeLab Research we run a luck test on every result before we believe it. This post explains how it works, shows a rule that looked excellent and then matched random coin flips, and gives you five steps to test your own trade list. Everything here is a historical simulation, not investment advice.
Table of Contents
Why a luck test matters more than a pretty equity curve
Markets are noisy. Over a few hundred trades, a rule with no edge at all can produce a smooth, rising line by chance. The equity curve cannot tell you which part came from the rules and which part came from the dice.
The numbers on retail trading are hard to ignore. A study of Taiwan day traders from 1992 to 2006 found that less than 1% were predictably profitable after fees. The key word is predictably. Plenty of traders had good years. Very few could repeat them, which is exactly the gap between luck and skill.
A luck test closes that gap in a practical way. It asks one question: if I kept everything about these trades the same except the part that is supposed to be clever, would random choices do just as well? If the answer is yes, the clever part added nothing.
I learned this the hard way while building our test method. Rules that looked convincing on a chart kept failing once we compared them with random twins. Today no result leaves our desk without that comparison. You can read the full process on our how we test page.
What luck looks like inside a backtest
Luck rarely looks like luck. It looks like a pattern. A breakout rule catches three big trend days in one year. A reversal rule happens to buy every dip in a rising market. A session filter removes the five worst trades by accident.
None of these feel random when you look at them. Each one comes with a story that sounds sensible. That is why a luck test has to be mechanical. It does not care about the story. It only compares your result with results that had no intelligence behind them.
There are three common sources of luck in trading results:
- Direction luck: your entries happened to be on the right side of a few large moves.
- Market luck: you only traded long while the market rose, so almost any long trade made money.
- Selection luck: you tried many settings and kept the best one, which is the most flattering by definition.
Each source needs its own check. The coin-flip luck test handles direction luck. The random-long test handles market luck. Counting your tries handles selection luck. We use all three.
The coin-flip luck test: same entries, random direction
Here is the core of our method. For every result, we build 200 “coin-flip” versions of the same strategy. Each version keeps the exact entry times, the same stop distance and the same target distance. The only change is the direction: for each trade, a coin flip decides buy or sell.
Then we run all 200 versions through the same engine, on the same broker data, with the same recorded spread at each fill and the same overnight financing. Fills happen at the next bar’s open. Stops and targets are followed minute by minute, and when both are hit in the same minute, the stop counts first.
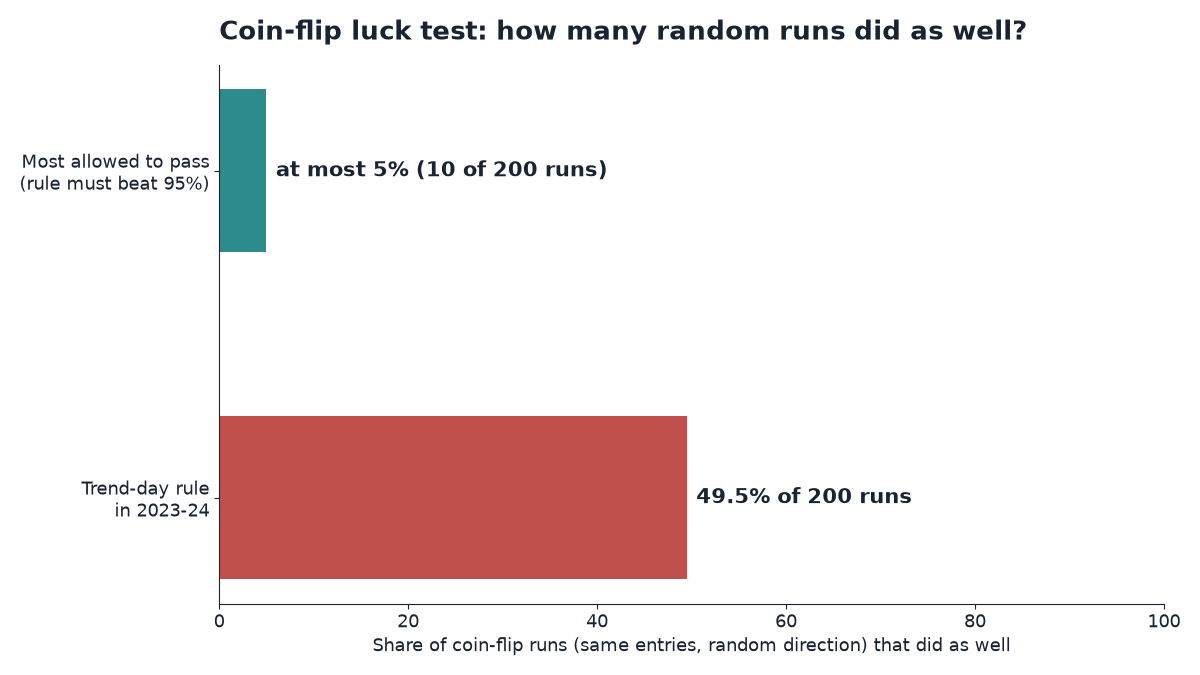
The real strategy must beat 95% of the 200 coin-flip runs. If more than 10 of the random versions do as well, the result fails the luck test, no matter how good it looked on its own.
Why this design? Because it isolates the one thing a signal claims to know: which way price will go next. Timing, trade size, stops, targets and costs are all held constant. If your direction calls are no better than coin flips, your edge is not in your signal.
Why 200 runs and a 95% bar
Two hundred runs is enough to see where the real result sits among random ones without making the test slow. The 95% bar is a common threshold for “unlikely to be chance”. It is not magic, and we do not treat it as proof of skill.
A pass on the coin-flip luck test is necessary, not sufficient. In our validation period, a rule also needs a t-statistic of at least 2.0 on at least 100 trades, and it must stay positive when we charge 1.5 times the spread. Costs often decide the outcome, which we cover in our post on trading costs.
The random-long luck test for rising markets
The coin-flip test has a blind spot. Imagine a rule that only buys. If the market went up strongly during the test, almost any buy at almost any time would have made money. Flipping the direction of those trades makes the random versions look terrible, so the real rule passes easily. It has learned nothing except “the market went up”.
So for long-only rules we add a second luck test: 200 “random long” runs on the same bars. Each run takes long trades at random times, with the same holding rules and costs. The real rule must again beat 95% of them. Now it has to beat other buyers, not sellers.
This matters most in markets with a strong trend. In our independent assessment of a 39-strategy library, the only pass was a linear regression slope rule on Bitcoin H1, at +0.32R per trade with a t-statistic of 3.1. Its gains came mostly from long trades while Bitcoin rose about 8 times over the period.
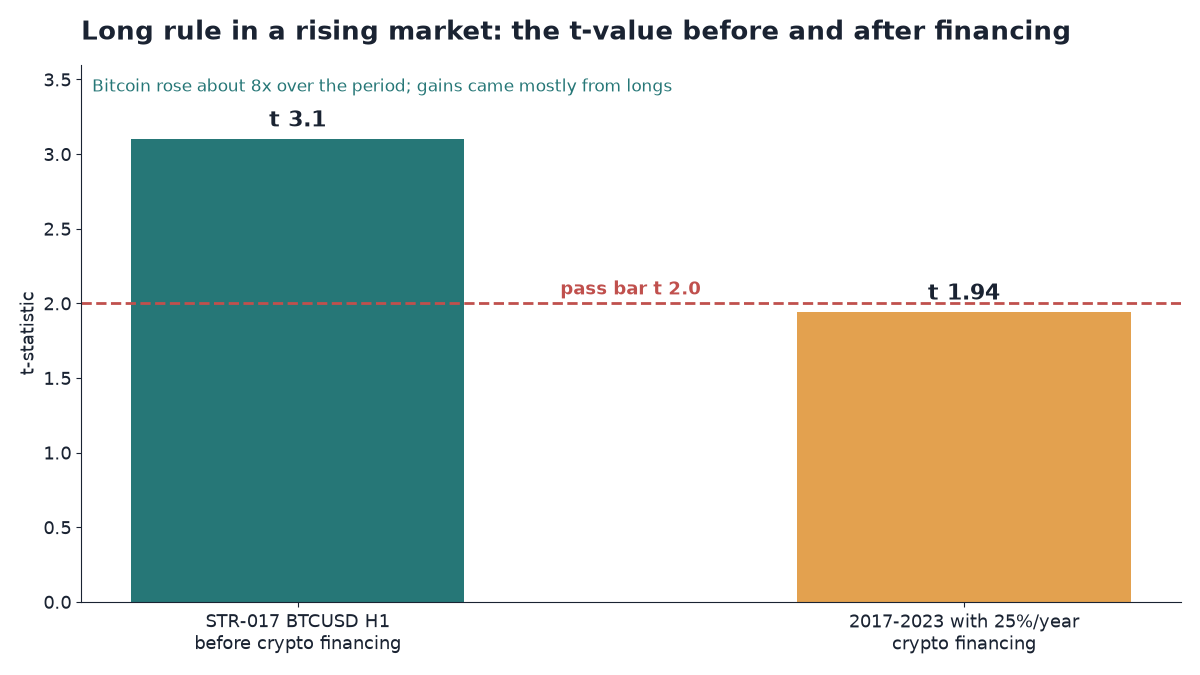
That is exactly the situation the random-long luck test exists for. And when we added 25% a year crypto financing, the 2017-2023 result fell to t 1.94, under the 2.0 bar. A similar story showed up in a 20-day Donchian breakout long rule: Bitcoin and Ethereum supplied 88% of its profit. We say more about this in our crypto trading strategy post.
Multiple testing: why 806 settings produce lucky winners
The third source of luck is the one that fools experienced researchers. It is called the multiple comparisons problem, and the idea is simple. Every test you run is another roll of the dice. Run enough of them and some will come up winners by chance.
Our edge search covered 806 rule settings across 38 families in six rounds. Suppose none of them had any edge at all. With a bar that lets 1 in 20 random results through, you would still expect about 40 “winners” from 806 tries. Each of those 40 would look like a discovery. Each would come with a story.
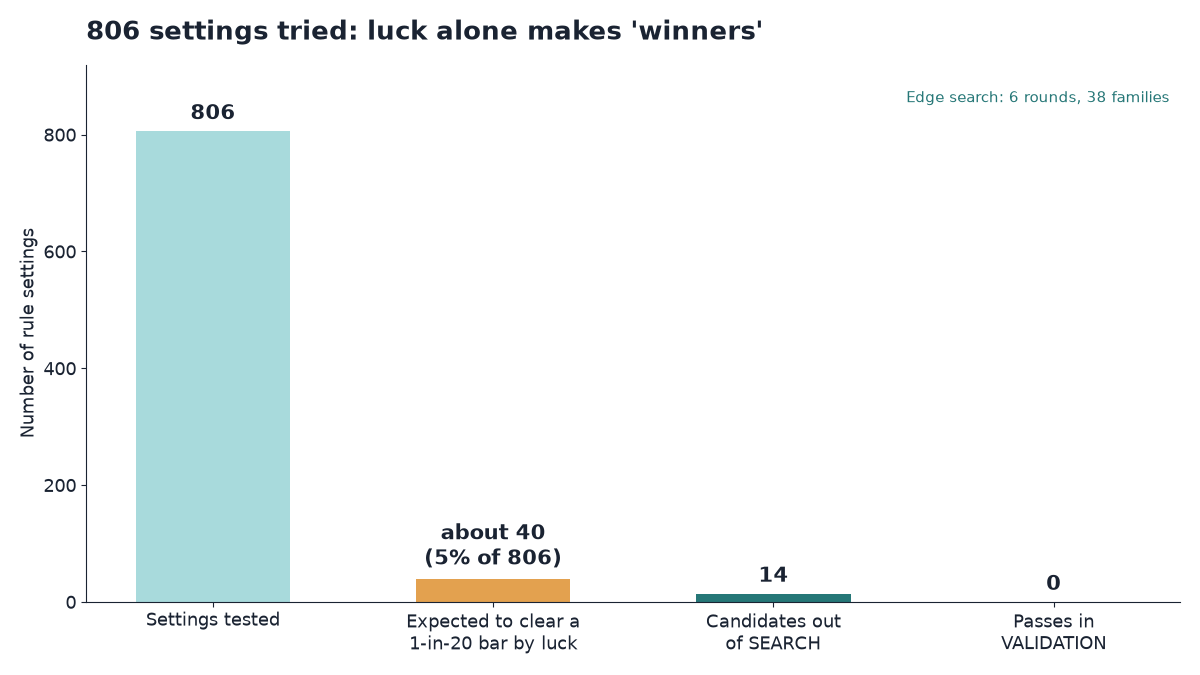
This is why a single luck test on a single result is not enough when the result is the best of many. You have to count how many things you tried. When we tested 25 suggested improvements on new markets, we raised the bar to t ≥ 3.11 using the Bonferroni correction. Zero of the 25 cleared it.
The habit of searching until something works has a name: data dredging. It is not cheating on purpose. It happens naturally when you tweak an indicator, rerun the backtest and keep what looks best. A luck test that ignores those hidden tries will be too kind.
In our programme we also apply a stricter bar to recycled ideas. If an idea had already been tested on the same data, it needs t ≥ 2.5 instead of 2.0. Out of 806 settings, 14 candidates made it out of the search period. None survived validation. Zero valid passes.
Case study: the trend-day rule the luck test exposed
The best example I have is a trend-day continuation rule on US500, US100 and US30. In our search period it looked like the real thing: +0.13R per trade, a t-statistic of 2.84 on 985 trades, positive on all three markets and in 5 of 6 years.
On paper, that is a strong profile. It had enough trades, more than one market and consistency across years. It made it out of the search period as a candidate, and our candidate rules include a plateau: neighbouring settings must be positive too, so no single lucky number.
Then we ran it on 2023-2024, a period it had never seen. The average fell to −0.022R per trade, with a t-statistic of −0.35. And the coin-flip luck test told the rest of the story: 49.5% of the random-direction versions did as well as the real rule.
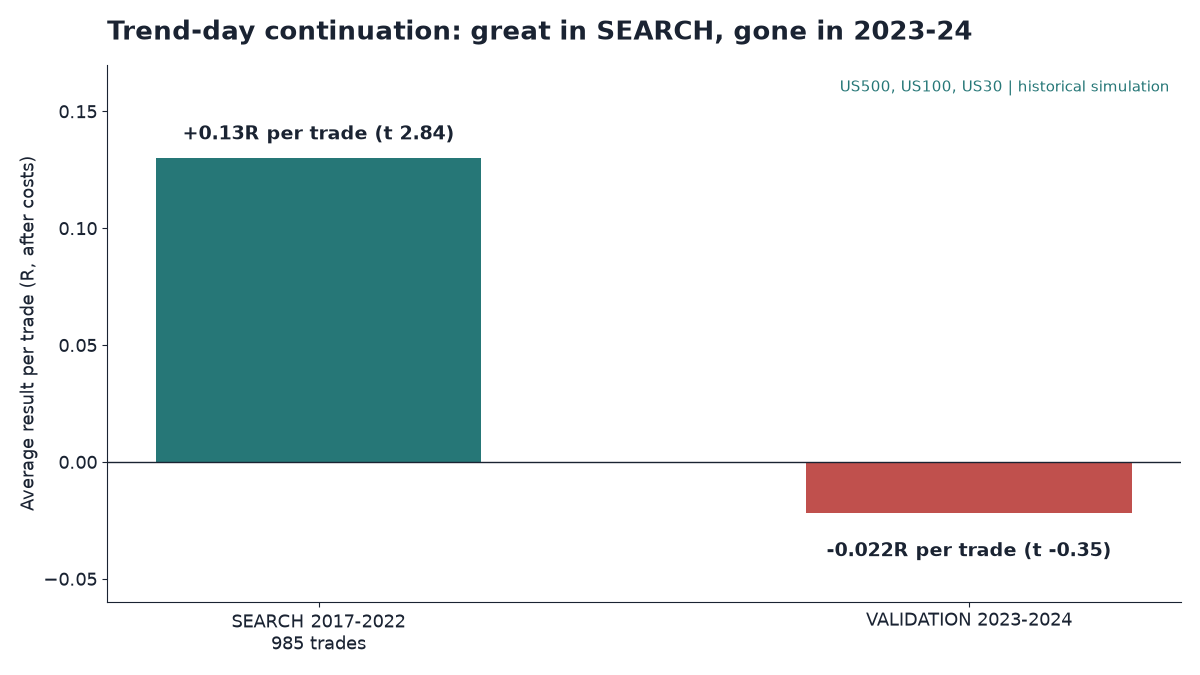
Put simply, a coin flip was as good a guide to direction as the rule. The search-period result had been a run of favourable days, not a repeatable edge. The luck test did not need a theory about why. It only needed a fair comparison.
This is also why we split time into search, validation and a sealed final period. A luck test on the same data you used to choose a rule is weaker than one on fresh data. Read more in our guide to out-of-sample testing.
How to run a simple luck test on your own trades in 5 steps
You do not need our full engine to run a basic version. You need a trade list, the price data behind it and a little patience in a spreadsheet or a short script. Here is the five-step luck test I would give any retail trader.
Step 1: Export a clean trade list
For each trade, record the entry time, direction, stop distance, target distance and the result in R. One R is the amount you risked on that trade. Use results after spread, commission and overnight financing, because costs are part of the truth.
Check your data before you trust it. In one study, our broker’s export recorded a spread of zero for whole months of Bitcoin, 12% of all minutes. Zero-cost trades look great and mean nothing. We replaced those zeros with that month’s median spread.
Step 2: Measure your real result and its t-value
Work out your average R per trade and its t-statistic. The t-statistic is the average divided by the standard deviation, then multiplied by the square root of the number of trades. A t of 2.0 is a rough minimum; we also ask for at least 100 trades.
Write the number down before the next step. Writing first stops you from moving the goalposts later. This is a small version of the pre-registration we use for every run, where rules and pass bars are fixed in advance.
Step 3: Build the coin-flip versions
Now create random twins. Keep every entry time, stop distance and target distance, and let a random number pick buy or sell for each trade. Then replay each twin on the price data with the same costs, the same stop-first rule and the same exits.
The replay matters. The reverse of a winning trade is not simply a loser of the same size, because the stop and target swap sides and both directions pay the spread. A rough shortcut only works when the stop and target are equal. If you can, replay properly.
Step 4: Run 200 times and rank your result
Repeat step 3 two hundred times and record each run’s average R. Sort the 200 numbers and see where your real result lands. To pass this luck test, no more than 10 of the 200 random runs may do as well as yours.
If your strategy is long-only, add the random-long version: 200 runs of long trades at random times on the same bars. Your rule should beat 95% of those as well. If it does not, the market’s trend did the work, not your entries.
Step 5: Count your tries and stress the costs
Finally, be honest about how many versions you tried before this one. If you tested 20 indicator settings and kept the best, your result needs a higher bar than a single pre-planned test. Our re-tested ideas need t ≥ 2.5; our 25-fix study needed t ≥ 3.11.
Then charge 1.5 times the spread and check the result stays positive. Many results that pass a luck test still fail on costs. For short holds, the spread was often bigger than the edge itself; we show that in our forex scalping spread study.
Common mistakes when you run a luck test
The five steps are simple, but a few errors can make any luck test meaningless. These are the ones that matter most.
| Mistake | What goes wrong | Fix |
|---|---|---|
| Changing entry times in the random runs | You test timing and direction together | Keep entry times fixed |
| Ignoring costs in the random runs | Random twins look worse than they should | Same spread and financing |
| Only coin flips for a long-only rule | A rising market flatters the rule | Add random-long runs |
| Testing on the tuning data only | The rule was fitted to that luck | Use a later, unseen period |
| Forgetting the settings you discarded | Selection luck stays hidden | Count tries, raise the bar |
One more mistake is subtle. Some rules use limit orders that fill at prices better than real fills would be. In our SMC tests, 45% of “limit” fills were at a better price than the level itself. Re-pricing them to the level took the best setting from +0.133R to about zero. No luck test can catch a fill error; you have to fix the simulation first.
What a luck test cannot tell you
A luck test is a filter, not a verdict of skill. Passing it means your result is unusual compared with random choices. It does not mean the edge will last, that it is large enough to trade, or that it survives the costs at your broker.
It also cannot fix bad data or code bugs. When we assess a bot, we often find trades that the code takes but the written rules do not intend, such as duplicate signals or missing timeouts. A luck test on a buggy trade list only measures the bug. Our independent bot testing service checks both.
Finally, a luck test does not protect you from overfitting on its own. A rule tuned hard enough can beat random twins on the data it was tuned on and then fail on new data, as the trend-day rule did. Fresh, untouched data is the second half of the defence.
Looking across our work, the pattern is clear. Of 39 library strategies, one passed and then failed once financing was added. Of 806 edge-search settings, none passed. The luck test was one of the tools that kept us from fooling ourselves, and from fooling you. Our backtest results post has the full picture.
Key takeaways
- A luck test compares your strategy with random versions of itself: same entries, same stops and targets, same costs, random direction.
- We run 200 coin-flip versions per result and require the real rule to beat 95% of them.
- Long-only rules also need a random-long luck test, because a rising market makes almost any buy look smart.
- Trying many settings creates lucky winners: 806 tries would produce about 40 by chance at a 1-in-20 bar.
- Our trend-day rule looked strong in search (t 2.84) and then matched coin flips in 2023-24, with 49.5% of them doing as well.
- Run your own luck test in five steps, count every try, and stress your costs before you trust any result.
If you want to see every rule we apply, read how we test. If you have a bot or a written strategy and want an independent luck test on your broker’s real costs, you can get your bot tested. Either way, put your best result through a luck test before you put money behind it.