These are our backtest results for 39 classic strategies, 25 suggested improvements and 806 rule settings, and the short version is blunt: nothing passed. One rule looked like a winner for a while. It stopped passing the moment we added the cost of holding Bitcoin overnight.
I am Theoneste NZAKIZWANIMANA, founder of TradeLab Research. We test trading rules the slow way, on real broker prices and real costs. This post is the headline story of the whole programme, with the numbers and the seven lessons that cost us the most to learn.
Everything below is a historical simulation, not investment advice. Nothing here is a recommendation to trade any strategy or market, and none of these backtest results is a promise about the future.
Table of Contents
What our backtest results cover
Every number in this post comes from the same method. The full version lives on our how we test page. Here is the part you need to judge the backtest results that follow.
- The strategy’s own code decides every trade. We check everything else from the outside.
- Data is OANDA MetaTrader 5 one-minute prices from 2017 to 2026, with the spread the broker recorded at each fill.
- Depending on the study, that means 15-17 markets across FX, indices, metals, oil and crypto.
- Orders fill at the next bar’s open. Stops and targets are followed minute by minute, and if both are hit in the same minute, the stop counts first.
- Results are in R, where 1R is the amount risked on a trade, after spread and overnight financing.
- Financing is a stated assumption: 3% a year on FX, 6% a year on metals, indices and oil, and 25% a year on crypto.
Three time periods and a sealed lockbox
Time is split in order. SEARCH runs from June 2017 to December 2022, and tuning is allowed there. VALIDATION covers 2023-2024 and is run once, on frozen candidates only. LOCKBOX is 2025 onwards. It is sealed, to be opened once for the whole programme, and it has still never been opened.
Before each run, we wrote down every rule, settings grid and pass threshold and hashed the file with SHA-256. That is pre-registration. A correction becomes a dated amendment, never a silent edit. It stops you moving the goalposts after you see your backtest results.
The pass bar
A rule passes VALIDATION only if all three of these hold:
- a t-statistic of at least 2.0 on at least 100 trades, or 2.5 if the idea had already been tested on that data;
- it beats 95% of 200 coin-flip runs that use the same entry times and the same stop and target distances, but a random direction;
- it is still positive when we charge 1.5 times the spread.
To leave SEARCH at all, a candidate needs a plateau (all neighbouring settings also positive), gains on at least two thirds of its markets, at least 200 trades and t of 2.5 or more. Our posts on the luck test and on out-of-sample testing explain both ideas step by step.
Here are the backtest results of all three studies in one table before we go through each one.
| Study | What we tested | Outcome |
|---|---|---|
| 39-strategy assessment | 39 classic strategies, default settings, 4 markets, M15 and H1 | 1 pass (gone with crypto financing), 4 inconclusive, 34 fail |
| 25 improvements | The most promising fixes, on markets they had never seen | 0 of 25 confirmed (bar: t of 3.11 or more) |
| Edge search | 806 rule settings in 38 families, 6 rounds | 14 candidates, 0 passes in VALIDATION |
Backtest results from 39 classic strategies
The first study was an independent assessment of a library of 39 registered strategies, finished on 18 November 2026. These were the classics many traders start with: support and resistance breakouts, engulfing reversals, the EMA 9/21 crossover, RSI and MACD signals, Bollinger reversion, Donchian and ATR breakouts, Supertrend, Ichimoku, pin bars and inside bars.
It also held newer favourites such as opening range breakouts, fair value gap retraces, order block retests and liquidity sweep reversals. We used default parameters only, so nothing was tuned to the data.
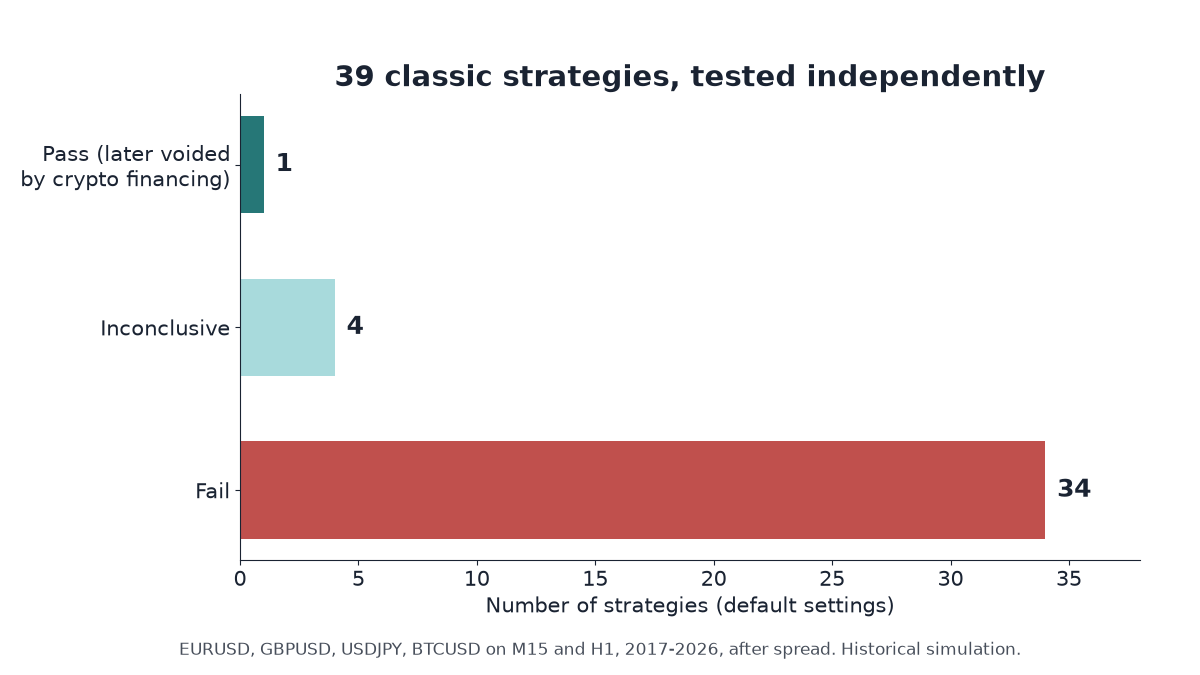
Each strategy ran on EURUSD, GBPUSD, USDJPY and BTCUSD, on M15 and H1, from 2017 to 2026. The backtest results came out at 1 pass, 4 inconclusive and 34 fail.
The one pass, and why it vanished
The single pass in these backtest results was STR-017, a linear regression slope rule on BTCUSD H1. It made +0.32R per trade with a t of 3.1. That looks strong until you ask where the gains came from: mostly long trades, during a period when Bitcoin rose about eight times.
Long Bitcoin positions cost money to hold overnight. When we added the 25% a year crypto financing assumption, the rule no longer passed: over 2017-2023 its t fell to 1.94, under the 2.0 bar. Riding a rising market and paying to hold it is not an edge.
The four inconclusive strategies (STR-008 Donchian, STR-011 Supertrend, STR-015 and STR-025) told a similar story. They were trend rules whose backtest results were positive on BTCUSD H1 in 2017-2023 but were not confirmed in 2024-2026.
What the 39 reports kept saying
Every strategy got its own report, and the same findings kept coming up:
- A regime filter was suggested for 33 strategies.
- For 32, “the signal points the wrong way”: price reverses right after entry, yet the opposite trade still loses after the spread.
- A session filter came up for 29.
- Dropping M15 came up for 16.
- Keeping more of the edge that the spread eats came up for 15.
- Reworking the entry itself came up for 12.
Two side findings matter for anyone producing backtest results. Our independent simulator agreed with the library’s own engine, but we found one engine issue. Trades whose stop sat inside the spread at the fill produced meaningless numbers, down to −10^11 R. Those trades are now skipped.
The second was in the data. The broker export recorded zero spread for whole months of Bitcoin, 12% of all BTC minutes. We replaced each zero with that month’s median spread. Check the spread column in your data before you trust any backtest results built on it.
25 improvements, 0 confirmed
The reports suggested fixes, so the obvious next step was to test them. We took the 25 most promising: pullback entries, H1-only versions, session filters, regime filters and similar changes.
The key choice was where to test them. A fix found by staring at EURUSD and BTCUSD will always look good on EURUSD and BTCUSD. So we tested every fix on markets it had never seen: AUDUSD and GBPJPY from 2017 to 2026, and Ethereum from 2024 to 2026.
Because we were testing 25 ideas at once, we raised the bar with a Bonferroni correction to a t of 3.11. That deals with the multiple comparisons problem: test enough ideas and some will clear t 2.0 by pure chance. The backtest results were clear. Zero of 25 were confirmed.
Each fix made sense on paper. None of their backtest results carried over to fresh markets.
The edge search: 806 settings, 0 passes
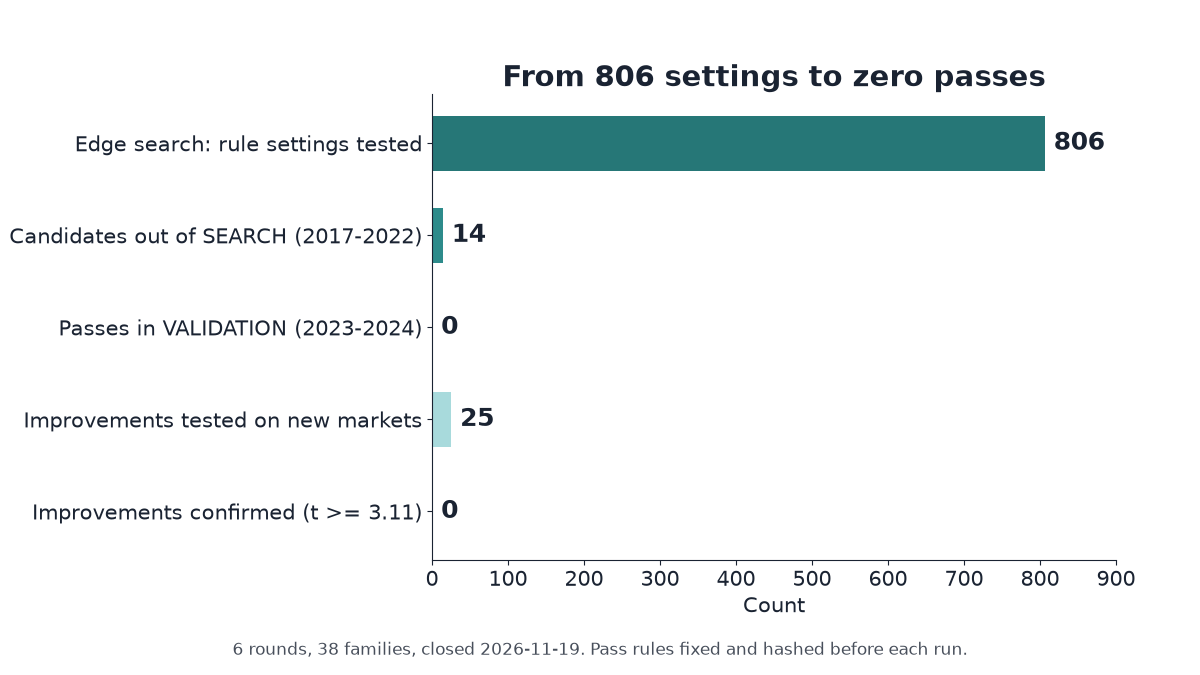
The third study was the biggest. Instead of fixing existing strategies, we went looking for any rule with an edge after costs. Over six rounds we tested 806 rule settings across 38 families, and we closed the search on 19 November 2026.
The families covered most ideas retail traders hear about: intraday momentum, opening-range breakouts, turn of the month, Williams volatility breakouts, Connors RSI(2), index opening gaps, the 08:30 US news bar and crude-inventory Wednesdays.
It also covered pre-holiday effects, 52-week highs, pre-FOMC drift, volume-conditioned moves, crypto taker-flow imbalance, and 34 settings of SMC combined with Malaysian support and resistance (MSNR). Fourteen candidates made it out of SEARCH. None survived VALIDATION.
Those are the backtest results that matter most to me, because the bar never moved while we searched.
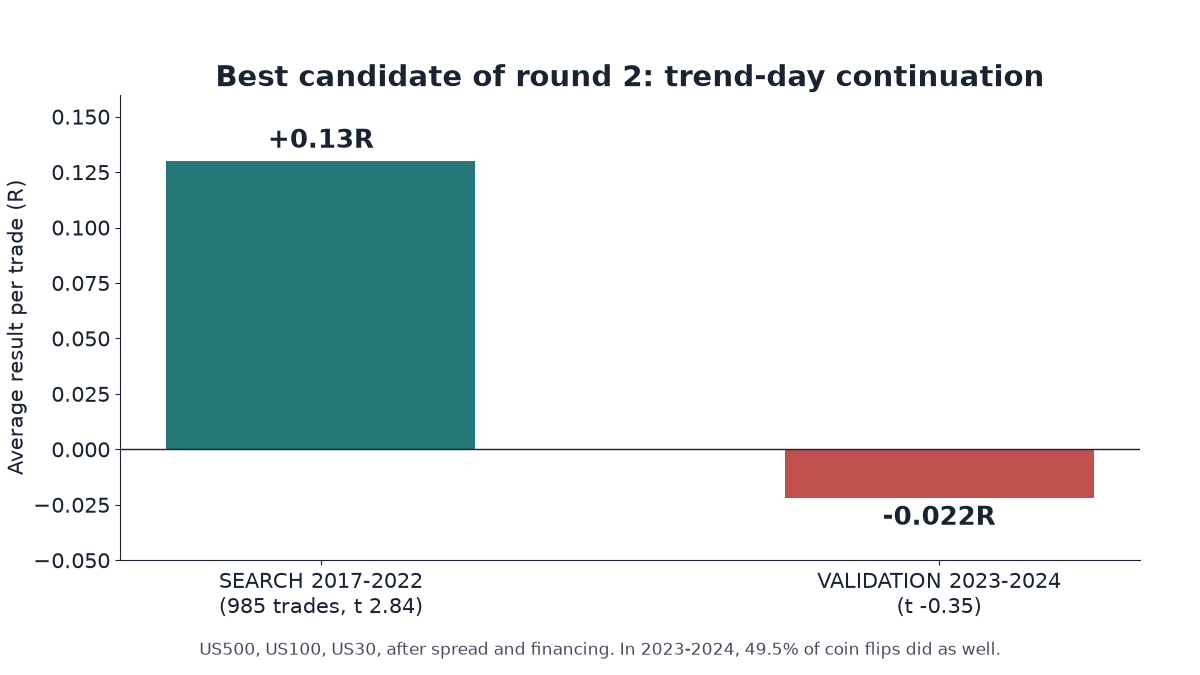
Round 2’s best candidate shows how our backtest results usually went. Trend-day continuation on US500, US100 and US30 made +0.13R per trade in SEARCH, with t 2.84 on 985 trades. It was positive on all three markets and in 5 of 6 years.
In 2023-2024 the same frozen rule made −0.022R per trade, with a t of −0.35. Almost half of the coin-flip runs, 49.5%, did as well as the real rule.
7 hard lessons from our backtest results
Zero passes is not the interesting part. The interesting part is why rules that looked good stopped looking good. These are the seven lessons I would pass on to any trader reading backtest results, including ours.
Lesson 1: Costs decide most backtest results
The main finding of the whole programme is about costs, and it comes in three shapes. Short holds lose to the spread. Asian-session FX mean reversion made +0.04 to +0.11R per trade before costs but paid 0.14-0.22R per trade in spread. All 12 settings were negative after costs, at −0.07 to −0.17R.
Long holds lose to financing. Monthly time-series momentum made +0.01 to +0.06R per trade before financing and paid 0.06-0.09R per trade to hold. Its spread was only 0.004-0.007R. Daily Donchian paid 0.13-0.35R per trade in financing.
In the middle, holds of one to five days had tiny costs: about 0.005R spread plus 0.005R financing on indices. But the edges there were even smaller, at most about +0.008R per trade for reversal rules.
Our post on trading costs breaks these numbers down, with a worked example. The short version: if backtest results ignore the bid-ask spread and overnight financing, they are not finished yet.
Lesson 2: Luck looks like skill
Backtest results built on a few hundred trades can look excellent by chance. That is why every result faces 200 coin-flip runs with the same entry times, the same stop and target distances and a random direction. For long-only rules we also run 200 random long entries on the same bars, because a rising market makes any long rule look clever.
The trend-day rule is the clearest example. In VALIDATION, 49.5% of the coin flips did as well as the real rule. The coin flips say there was very little signal to begin with.
Lesson 3: Overfitting hides in good-looking backtest results
Overfitting means fitting the noise in past data instead of a real pattern. With 806 settings, some will look great in SEARCH by accident. That is why we demanded a plateau, where neighbouring settings must also be positive, rather than one lucky peak.
Even plateaus were not enough. The SMC and MSNR round tested 34 settings with mechanical rules for levels, structure, order blocks, fair value gaps and liquidity sweeps. The best plateau reached t 0.65 and the best single setting t 1.05, against a bar of 2.5. Our SMC strategy backtest post has the full details.
That round also taught us a lesson about fills. 45% of “limit” fills were at a better price than the level itself. Re-pricing those fills to the level turned the best setting from +0.133R per trade to about 0.000R. Generous fills are a quiet form of overfitting, and they make backtest results look far better than any live account would.
Lesson 4: A bug can create a pass
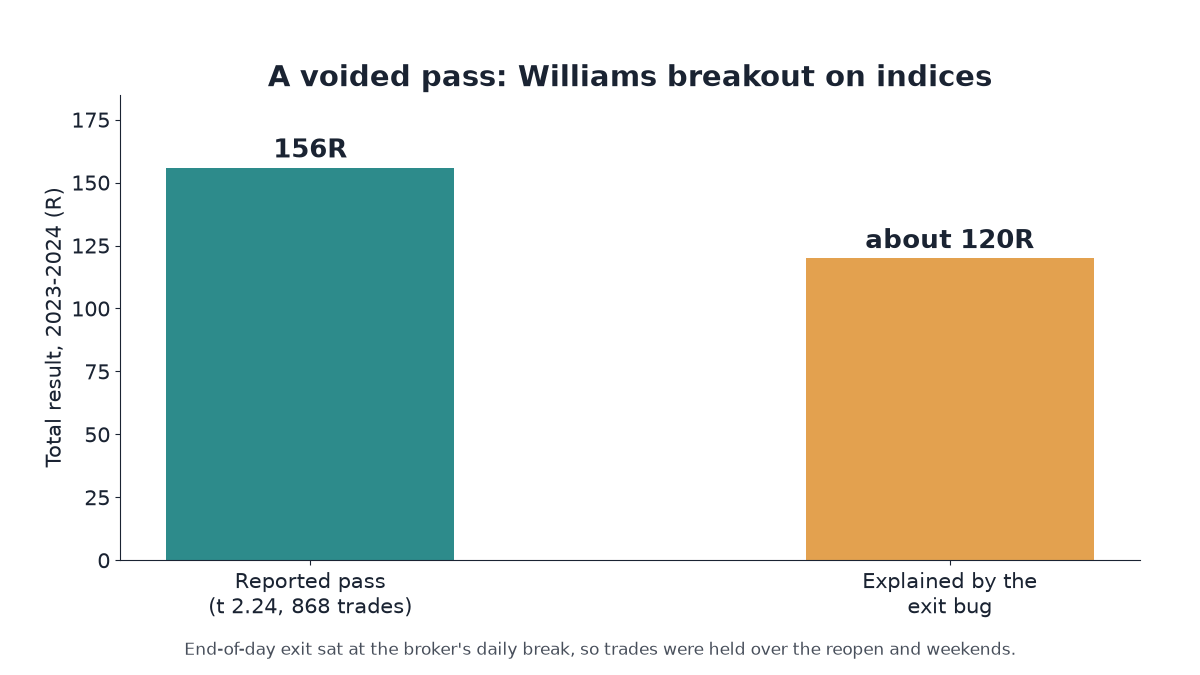
In round 1, a Williams volatility breakout rule on indices “passed” 2023-2024 with t 2.24 on 868 trades. Then we checked how the trades behind those backtest results ended. Its end-of-day exit was set at the broker’s daily break, so trades were being held over the reopen and over weekends.
That extra holding supplied about 120R of the rule’s 156R total. We voided the pass and recorded it as a dated amendment. The corrected rule then failed. Had we not inspected individual trades, we would have published a pass created by an exit bug.
Our bot testing work finds the same problem behind many clients’ backtest results: duplicate signals, missing timeouts and trades the written rules never intended.
Lesson 5: Crypto effects that vanish
Crypto flattered several backtest results. When we re-searched the Williams breakout, all of its SEARCH profit came from Bitcoin and Ethereum; without crypto it was about zero. In 2023-2024 the crypto effect vanished, with t values of 1.02, 1.22 and −0.43.
Round 6 tested Binance taker buy and sell imbalance on checksum-verified data. All 8 settings were negative, with t from −0.97 to −2.33, and the taker-buy share mostly mirrored the day’s own price move.
We dropped a funding-rate rule before testing it. It had only 94-193 independent extreme-funding episodes in 2020-2022, under our 200-trade minimum. Our crypto trading strategy post goes deeper.
Lesson 6: Near misses are not passes
Three sets of backtest results came close, and it would have been easy to round them up. A 20-day Donchian breakout long reached t 2.04 on 197 trades, but Bitcoin and Ethereum gave 88% of its profit. Buying near the 52-week high with a 5-day hold reached t 2.03 and was not stable.
The third was the pre-FOMC drift in US indices. Going long from the previous close to 13:45 New York time on Fed statement days made +0.040R per trade, t 2.38 on 191 trades. Holding through the 14:00 release gave the gain back.
All three are kept only for forward paper testing, with a read-out date of 30 November 2027. They are not passes.
Lesson 7: Why we publish failed backtest results
Most published backtest results are survivors. Nobody posts the 805 settings that failed next to the one that worked. That is data dredging by publication, and it leaves readers with a badly wrong idea of how easy edges are to find.
Publishing every failure does two things. It shows the real denominator, and it keeps us honest, because a pre-registered bar that never moves will happily say no. I would rather show you zero than sell you a curve.
How to read backtest results you are sold
Our backtest results sit inside a bigger picture. EU regulators’ studies cited by ESMA found that 74-89% of retail CFD accounts lost money, with average losses per client of EUR 1,600 to EUR 29,000. The UK FCA found 82% in its 2016 sample.
Academic work agrees. Among Taiwan day traders from 1992 to 2006, less than 1% were predictably profitable after fees. Our retail traders statistics post collects more of these studies.
When someone shows you a backtest, ask these questions before you look at the equity curve:
- Are the results after the broker’s real spread and overnight financing, or before?
- Were the rules and the pass bar fixed before the test, and can you see when?
- Is there a period the rule never saw during tuning?
- How many settings and ideas were tried before this one?
- Does it beat random entries with the same stops and targets?
- Does the profit come from one market, one year, or one trend such as Bitcoin’s?
- Can you see individual trades on the chart, including the exits?
If the seller cannot answer, those backtest results are a sales asset, not evidence. This is the same checklist we use when we test trading bots for clients.
What comes next after these backtest results
The edge search is closed. The pass bar does not move, and the three near misses sit on a forward watchlist rather than in a winners’ column.
Two more programmes have since run under the same rules, and both are closed. Programme 2 applied the method to Binance USDⓈ-M perpetual futures, where costs are lower: a 0.05% fee plus 0.02-0.05% slippage per side, with real 8-hourly funding, on a point-in-time top-20 universe of 137 coins that includes delisted ones such as LUNA and FTT. Its 52 pre-registered settings produced 0 candidates, so its lockbox was never opened.
Programme 3 tested Weltrade’s synthetic indices: 24 settings, plus checks on the price generator itself. The indices behaved exactly like their stated, fair generator, and costs made every rule negative. That is 0 candidates again, and its lockbox stays sealed. Across the three programmes, our backtest results now cover 882 rule settings with 0 survivors, published as plainly as a pass would have been.
Key takeaways
- Our backtest results across three studies: 39 strategies (1 pass that vanished with financing), 25 improvements (0 confirmed) and 806 settings (0 passes).
- Costs decided most outcomes: spread on short holds, financing on long holds, and edges smaller than costs at 1-5 days.
- Luck tests matter: in one case 49.5% of coin flips matched the best rule of the round.
- Plateaus, unseen time periods and honest limit fills removed what looked like edges.
- One pass came from an exit bug, so always inspect individual trades.
- Crypto trends drove several apparent edges, and then the effect vanished.
- Near misses go to forward paper testing, not to a list of winners.
These backtest results are historical simulations, not investment advice. If you want to see exactly how we reach them, read how we test. If you have a bot or a set of written rules you want checked the same way, get your bot tested.