Swap fees are the cost most traders forget, and in our research they quietly killed every trend-following system we tested on a monthly horizon. Each one looked fine before financing. Each one was negative after it.
I am Theoneste NZAKIZWANIMANA, founder of TradeLab Research. We test trading rules on years of broker data with the broker’s own costs. This post explains what we found about overnight financing, how it is charged, how to turn it into a number you can compare with your edge, and why systems that hold for weeks are hit hardest.
One note before we start. Everything below is a historical simulation, not investment advice. No strategy in this post is profitable, and I am not recommending that you trade any of them.
Table of Contents
What swap fees are and how they are charged
When you hold a CFD or a spot FX position past the broker’s daily cut-off, the broker charges (or sometimes pays) an overnight financing amount. Traders call these charges swap fees, rollover or overnight financing. They are the price of keeping a leveraged position open from one trading day to the next.
The charge is usually set as a yearly rate applied to the full value of your position, not to the margin you put up. That detail matters. With leverage, a small deposit can control a large position, and the financing is worked out on the large number.
In practice, swap fees work like this:
- The broker takes a yearly rate for the market and turns it into a daily charge.
- The charge is applied for each night the position stays open past the cut-off.
- The amount appears on your account as a small debit (or credit) per position per night.
- The exact schedule, including how weekends are handled, differs between brokers, so read your broker’s own table.
You can usually find the numbers in your platform. In MetaTrader 5, for example, the contract specification of each symbol lists the swap values for long and short positions. The values are often shown in points or in account currency, which makes them hard to compare with anything else. That is why we convert swap fees into R later in this post.
Because each night’s debit is small, it rarely feels like a cost. A few cents or a few dollars per night does not look like it could decide whether a system works. Our tests say it can.
How we modelled swap fees in every test
At TradeLab we do not let a backtest skip costs. Every result we publish is in R after the spread and after overnight financing. 1R is the amount risked on the trade, so a result of +0.05R means the average trade made five hundredths of what it risked.
We use broker 1-minute data from OANDA MetaTrader 5 with the spread the broker actually recorded at each fill, from 2017 to 2026. For financing we use stated yearly assumptions, because they apply the same way across all markets and studies:
| Market group | Financing rate we charge |
|---|---|
| FX pairs | 3% a year |
| Metals (gold, silver) | 6% a year |
| Stock indices | 6% a year |
| Oil | 6% a year |
| Crypto (BTC, ETH) | 25% a year |
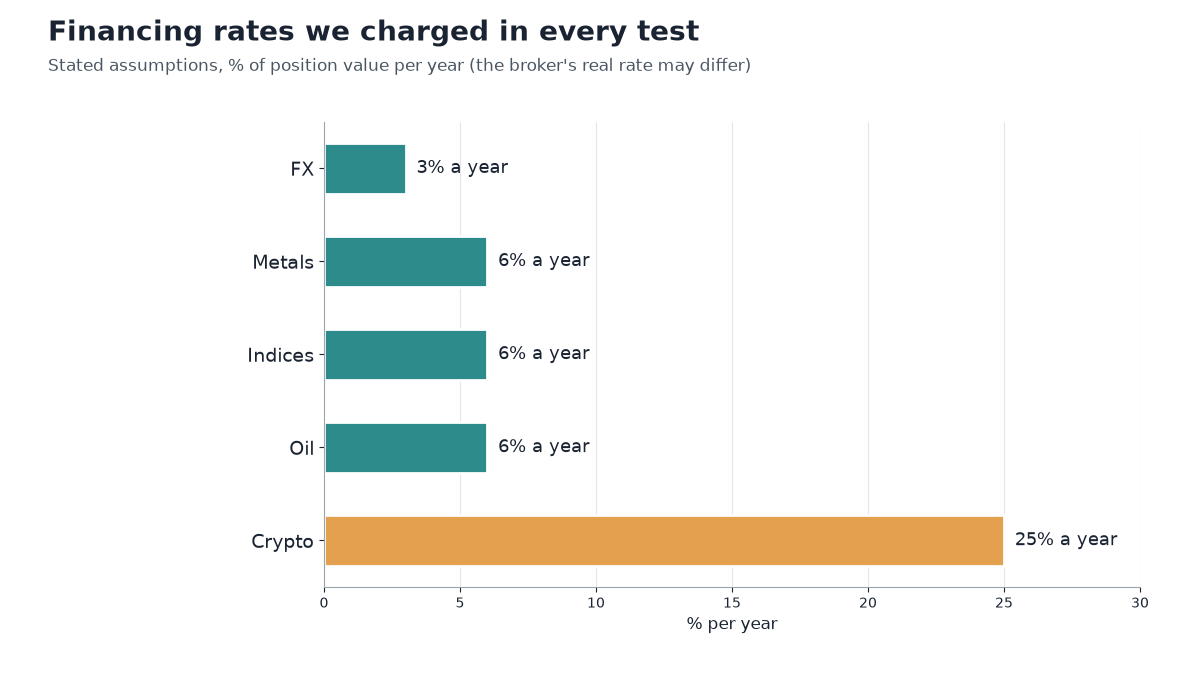
These are assumptions, not quotes from a broker. Your broker’s real swap fees may be higher or lower, and they move with interest rates. The point is that we always charge something, so no result looks better simply because a cost was left out. The full method is on our how we test page.
Swap fees killed all 8 monthly trend settings
In the third round of our edge search we tested monthly time-series momentum. The idea is old and simple: if a market has risen over the past months, hold it long; if it has fallen, hold it short. Positions last weeks, sometimes longer.
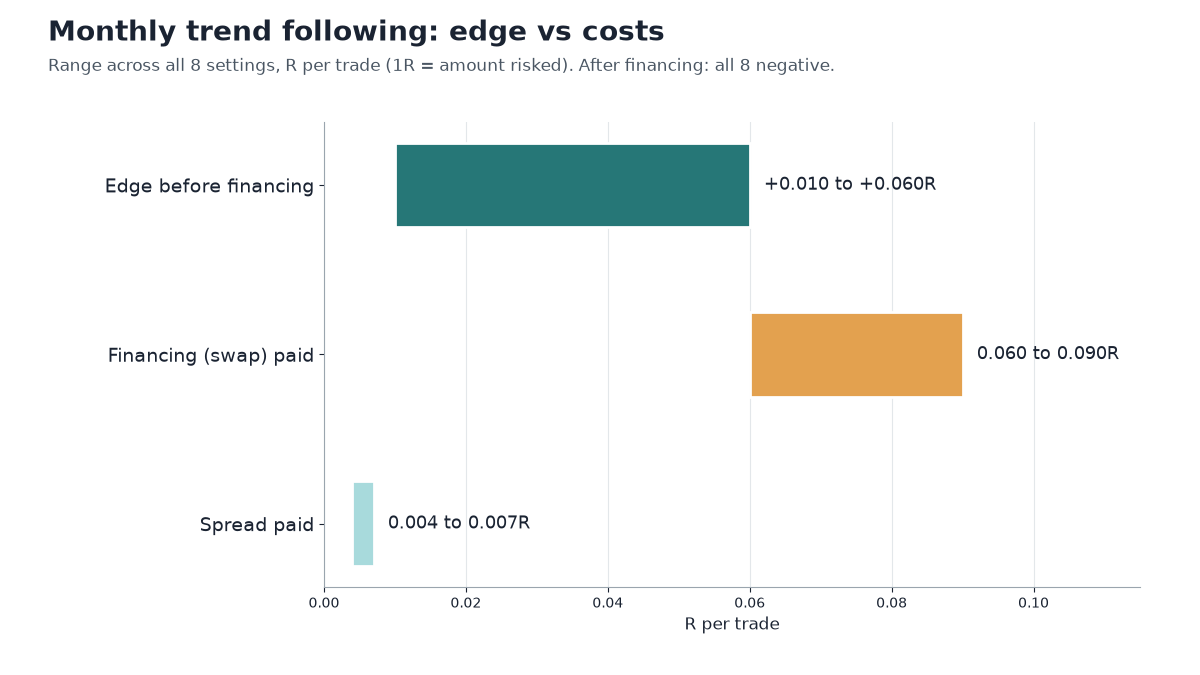
We ran 8 settings of this rule. Before financing, every one of them was positive, earning between +0.01R and +0.06R per trade. That is a thin edge, but it was an edge on paper.
Then we added the swap fees. Financing cost between 0.06R and 0.09R per trade. The spread, by contrast, cost only 0.004R to 0.007R per trade, because a position held for weeks pays the spread once but pays financing every night.
The result: all 8 settings were negative after swap fees. Not some. All of them. The cost of holding was larger than the gain from being in the trend.
This was not a close call that a lucky year could flip. The highest edge before financing, +0.06R, was equal to the lowest financing cost, 0.06R. Every other combination of edge and cost left the trade negative. Swap fees did not trim the result; they removed it.
Why the spread was not the problem
Many traders blame the spread for every lost edge, and for short holds that is often right. Here it was not. The spread on these trades was about one tenth of the financing.
That changes how you fix a system. A lower-spread account would have saved almost nothing on these trades. The only thing that would have changed the outcome is paying less to hold, or holding for less time. If you want to know how the spread affects short-term trading instead, see our post on forex scalping and the spread.
Daily Donchian: swap fees of 0.13-0.35R per trade
The same round tested a daily Donchian breakout: buy when price breaks above its recent high, exit on a trailing rule. Trades often stay open for weeks while a trend runs.
Financing on these trades cost between 0.13R and 0.35R per trade. That is a large share of what a breakout system can hope to earn on an average trade. For comparison, our cross-sectional momentum tests paid about 0.085R per trade in swap fees.
The 20-day Donchian breakout long did come close to our bar: t 2.04 on 197 trades, just under the 200-trade minimum. Bitcoin and Ethereum gave 88% of its profit. We keep it only as a near miss for forward paper testing. It is not a pass, and it is not a recommendation.
How crypto financing erased our only library pass
In a separate study we independently assessed a library of 39 registered strategies on EURUSD, GBPUSD, USDJPY and BTCUSD, on M15 and H1 charts, from 2017 to 2026. The result was 1 pass, 4 inconclusive and 34 fails.
The single pass was STR-017, a linear regression slope rule on BTCUSD H1. It made +0.32R per trade with a t-statistic of 3.1. Most of its gains came from long trades while Bitcoin rose about 8 times over the period.
Rising markets hide swap fees. When the long side of a market climbs for years, almost any rule that holds longs will show a profit, and the holding cost looks like a small price for a big move. Our luck test post shows how we separate the rule from the market with random long entries on the same bars.
That first test did not charge crypto financing. When we added our 25% a year assumption for crypto, the rule no longer passed: on 2017-2023 its t-statistic fell to 1.94, below our bar of 2.0. The swap fees alone took a strategy from “pass” to “fail”.
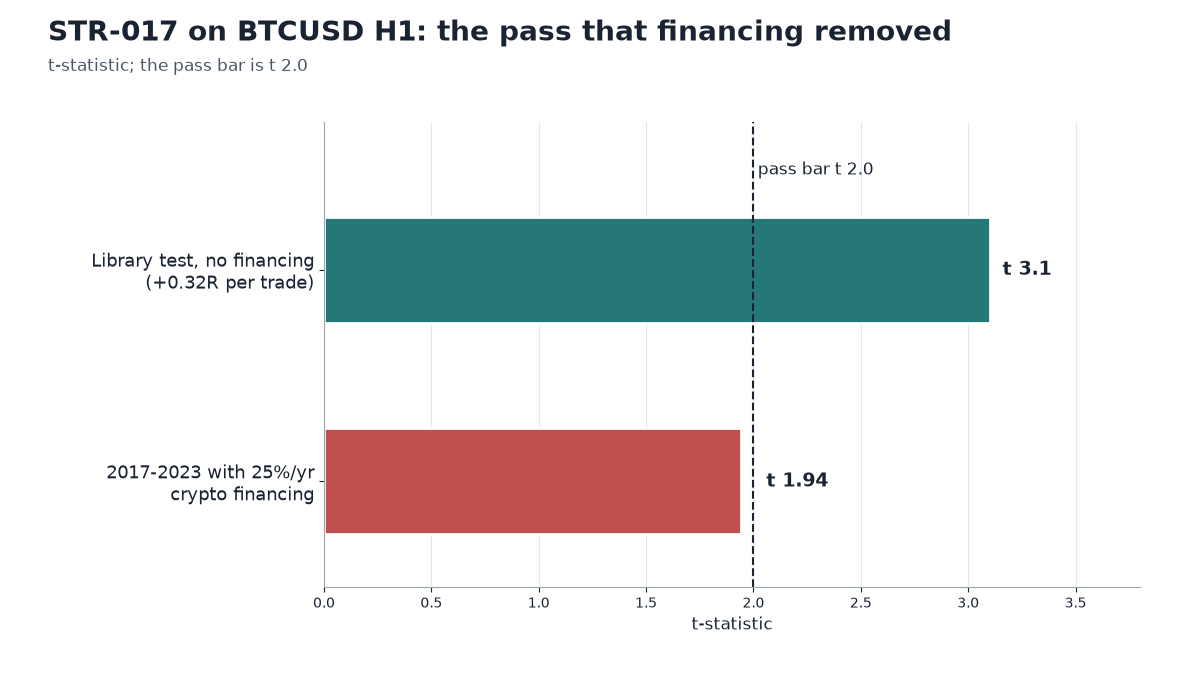
The lesson is uncomfortable. A strategy that mostly holds longs in a rising market can look excellent until you charge the full cost of holding. Our crypto assumption, 25% a year, is the highest of any market we test, so crypto systems that sit in trades for days deserve the strictest check. Our crypto trading strategy post covers that market in more depth.
Why long holds pay the most swap fees
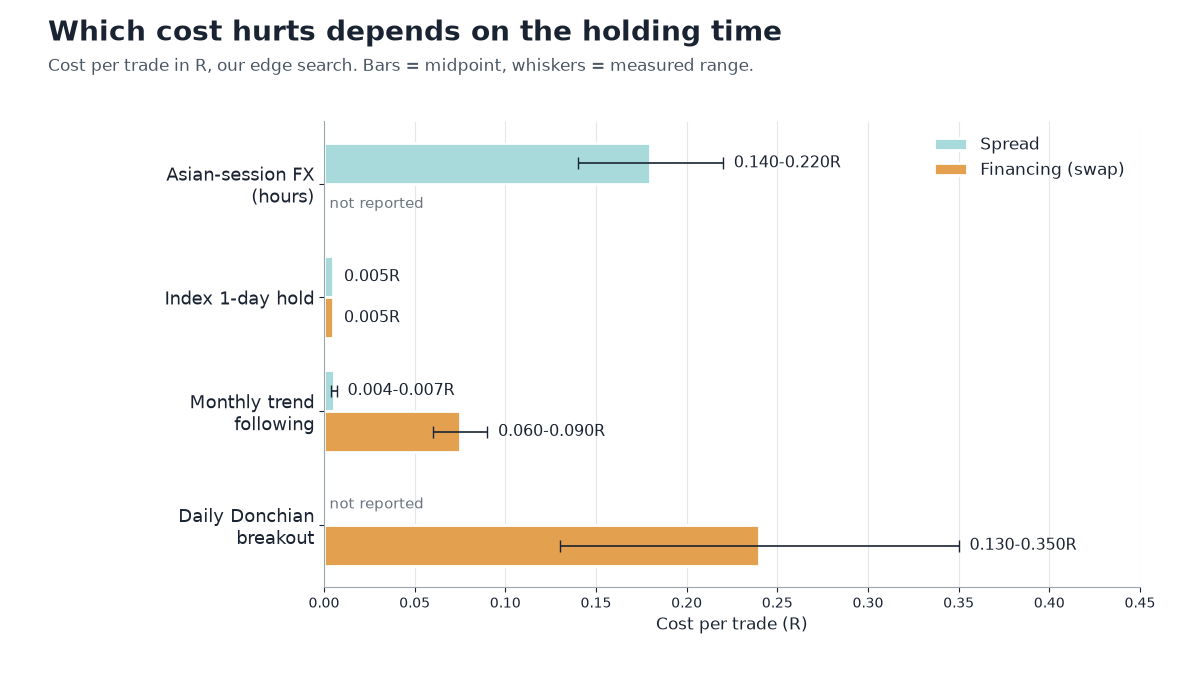
Holding time decides which cost hurts you. Our edge search tested many holding periods, and the pattern was clear across all of them:
| Holding time | Spread per trade | Financing per trade | What happened |
|---|---|---|---|
| Hours (Asian-session FX) | 0.14-0.22R | not the issue | +0.04 to +0.11R before costs; all 12 settings negative after |
| 1-5 days (indices) | about 0.005R | about 0.005R | costs small, but edges were at most about +0.008R |
| Weeks (monthly trend) | 0.004-0.007R | 0.06-0.09R | all 8 settings negative after financing |
| Weeks (daily Donchian) | small | 0.13-0.35R | best setting a near miss only |
Short holds pay the spread on every trade and hardly any financing. Long holds pay the spread once and swap fees on every night. Both ends of the range lost their edge to a cost; they just lost it to different costs.
In the middle, holds of 1 to 5 days had small costs. On indices, a one-day hold paid about 0.005R of spread and 0.005R of swap fees. Sadly, the edges we found there were smaller still: the reversal rules we tested at that horizon earned at most about +0.008R per trade.
So there is no safe holding period. There is only the question of whether your edge at that horizon is bigger than the cost at that horizon. The summary of all costs is in our trading costs post.
How to convert swap fees into R per trade
A swap charge in dollars tells you very little. What you need is the cost in R, so you can put it next to your edge in R. The conversion is simple arithmetic.
Start from the stop. If your stop is a distance d away from the entry price, written as a fraction of price, then a position that risks 1R has a value of 1R divided by d. A 2% stop means the position is worth 50 times what you risk.
Financing is charged on that full value. So the cost of holding, in R, is roughly:
Financing in R = yearly rate × (nights held ÷ 365) ÷ stop distance as a fraction of price
This is the single most useful formula for swap fees. It shows that the cost in R grows with three things: the yearly rate, the number of nights you hold, and how tight your stop is.
A worked example
These numbers are an illustration of the arithmetic, not results from our tests:
- An index position at 6% a year, held 30 nights, with a stop 3% from entry: 0.06 × 30 ÷ 365 ÷ 0.03 ≈ 0.16R.
- An FX position at 3% a year, held 30 nights, with a stop 1% from entry: 0.03 × 30 ÷ 365 ÷ 0.01 ≈ 0.25R.
- A crypto position at 25% a year, held 30 nights, with a stop 5% from entry: 0.25 × 30 ÷ 365 ÷ 0.05 ≈ 0.41R.
Notice the FX case. The yearly rate is the lowest, yet the tight stop makes the cost per trade higher than the index example. Low swap fees per year do not mean low swap fees per trade.
What makes the number bigger
- Longer holds. Twice the nights, twice the cost.
- Tighter stops. Halve the stop and you double the position value, so you double the financing in R.
- Higher rates. Crypto at 25% a year costs about eight times FX at 3% for the same position.
- Weekends. Depending on the broker, a position held over a weekend can be charged for the days the market was closed.
Compare that figure with your average result per trade before costs. If the swap fees are close to or above it, the system has no room left.
Swap-free accounts: read the terms first
Some brokers offer swap-free accounts, often called Islamic accounts. They can look like the answer to everything above. Be careful before you assume that.
A swap-free account does not mean holding is free. Brokers still need to cover the cost of financing a leveraged position. The terms may include an administration fee after a set number of nights, a limit on how long you can hold, a restricted list of markets, or wider spreads that build the cost into every trade.
If the cost moves into the spread, you pay it on every trade instead of every night. For a long-hold system that may be cheaper or more expensive; you only know by reading the terms and putting them into your backtest. The same rule applies: a cost you cannot see is still a cost.
Our advice is practical. Get the full fee schedule in writing, convert it to R per trade with the formula above, and test the system with that number. Never test on a swap-free assumption and then trade on a normal account.
How to check swap fees in any backtest
It is easy for a backtest to leave out swap fees entirely, whether it was built at home or sold with a product. A strategy tester can include them, but only if the settings are right and the report shows them. Here is the short checklist we use:
- Ask whether swap fees were charged at all. If the report shows only the spread, the result is incomplete for any system that holds overnight.
- Check the rate. Was it a realistic rate for each market, including the high crypto rates?
- Check the holding time. Average nights held tells you how much financing should appear.
- Convert to R. Use the stop distance to turn the yearly rate into R per trade.
- Compare with the edge. If swap fees per trade are close to the gross edge per trade, treat the result as a fail.
- Look at the long side and the short side. A system that holds longs in a rising market can look strong for reasons that have nothing to do with the rule.
Costs matter for retail traders more than most people admit. Australia’s regulator, ASIC, reported that 68% of retail CFD investors lost money in FY2024, more than A$458 million in total, including A$73 million in fees (ASIC media release). Studies cited by ESMA found that 74-89% of retail CFD accounts lost money.
The UK’s FCA found something similar in its own sample: 82% of clients lost money on CFDs (FCA press release). Neither figure is about swap fees alone. Both show that small, regular charges add up when traders hold leveraged products. The bid-ask spread and overnight financing are the two costs every CFD trade pays, and only one of them shows up in the price you see.
What we learned from charging swap fees honestly
I learned three things from these studies that changed how I look at any trend system.
First, a monthly or weekly system is not “low cost” just because it trades rarely. It trades rarely, but it pays every night. Our monthly trend settings paid ten times more in financing than in spread.
Second, a backtest that leaves out swap fees can make a fail look like a pass. STR-017 is our clearest example: t 3.1 without crypto financing, t 1.94 with it. If we had stopped at the first number, we would have reported a pass that was not real.
Third, the fix is rarely a better broker. The fix is a different question: does the edge per trade beat the full cost of holding, measured in R? If it does not, no account type will rescue it. Our out-of-sample testing post explains how we decide whether a result is real at all.
Key takeaways
- Swap fees are charged on the full position value, every night you hold past the cut-off, so leverage multiplies them.
- In our tests, monthly trend following was +0.01 to +0.06R per trade before financing and negative after it in all 8 settings.
- Daily Donchian breakouts paid 0.13-0.35R per trade in swap fees; cross-sectional momentum paid about 0.085R.
- Our only library pass, STR-017 on BTCUSD H1, fell from t 3.1 to t 1.94 once 25% a year crypto financing was charged.
- Convert swap fees to R per trade: yearly rate × nights held ÷ 365 ÷ stop distance as a fraction of price.
- Short holds lose to the spread, long holds lose to swap fees; check which one your system pays.
- A swap-free account may still charge for holding through fees, limits or wider spreads, so read the terms and test with them.
If you want to see exactly how we charge costs, read how we test. If you run or plan to buy a system that holds positions overnight, we can test it independently on broker data with real spreads and financing: see bot testing.